
Thermodynamic Cycles: Tips & Tricks

Thermodynamic Cycles: Tips & Tricks

Problem Solving Guide

Algorithm

Make a thermodynamic state variable table

Begin filling in the table with "non-calculation" values - values you can read right off the plot.

Use proportional reasoning to find the Tempearture at the points in the cycle.

If actual numbers are given in the problem, calculate the numerical value of P, V, and T at the points on the cycle.


Make a First Law table.

Fill in zeroes during steps where there is no work - whenever $V$ is constant.

Calculate $\Delta E$ for each step by using the equipartition theorem $\Delta E = D\frac{1}{2}Nk_b \Delta T$ where D is the degrees of freedom for your substance - $D=3$ for a monatomic gas.

Use the First Law $\Delta E = Q + W$ to solve for the heat. 

Recall that $ PV = nRT = Nk_B T$, so if you have the equipartition theorem that says $\frac{3}{2} Nk_B \Delta T = \Delta E$, you can relate that to $PV$, which makes adding up totals easier. Do not report Q totals as ex $3NRT - PV$, convert to the same state variables.

Fill in remaining spots on table and sum up totals.

*GOOD way to check your work: Make sure that total $\Delta E=0$.

Misconceptions & Mistakes

  •  

Pro Tips

  •  

Multiple Representations

Multiple Representations is the concept that a physical phenomena can be expressed in different ways. 

Physical

Physical Representations describes the physical phenomena of the situation in a visual way.

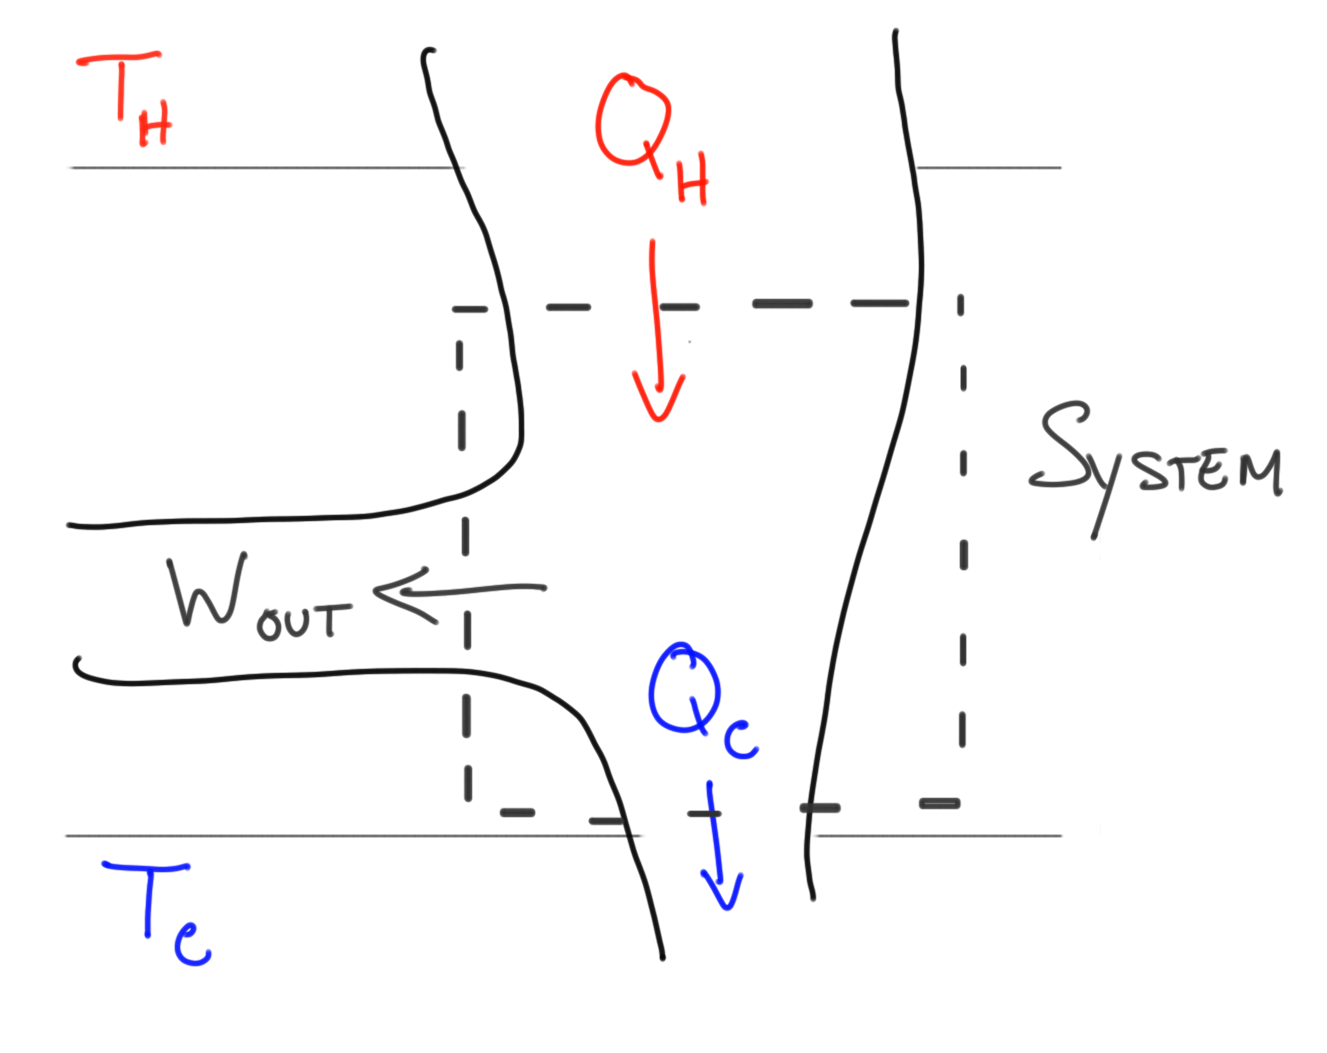
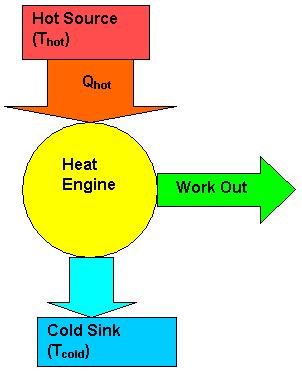
The diagrams below describe the heat engine process.The heat engine, or system takes in energy from a hot source where the heat energy is extracted to do work and waste leaves the system as used energy to the cold resevoir. 

This is a diagram is a heat engine with a cold and hot reservoir. The Q hot is an arrow that points from the hot reservoir to the system where that energy is converted to work out of the system and Q cold out of the system and into the cold reservoir.


This is a diagram is a heat engine with a cold and hot reservoir. The Q hot is an arrow that points from the hot reservoir to the system where that energy is converted to work out of the system and Q cold out of the system and into the cold reservoir.

Mathematical

Mathematical Representation uses equation(s) to describe and analyze the situation.

$\Delta E = Q+W$

$PV=NK_{b}T$

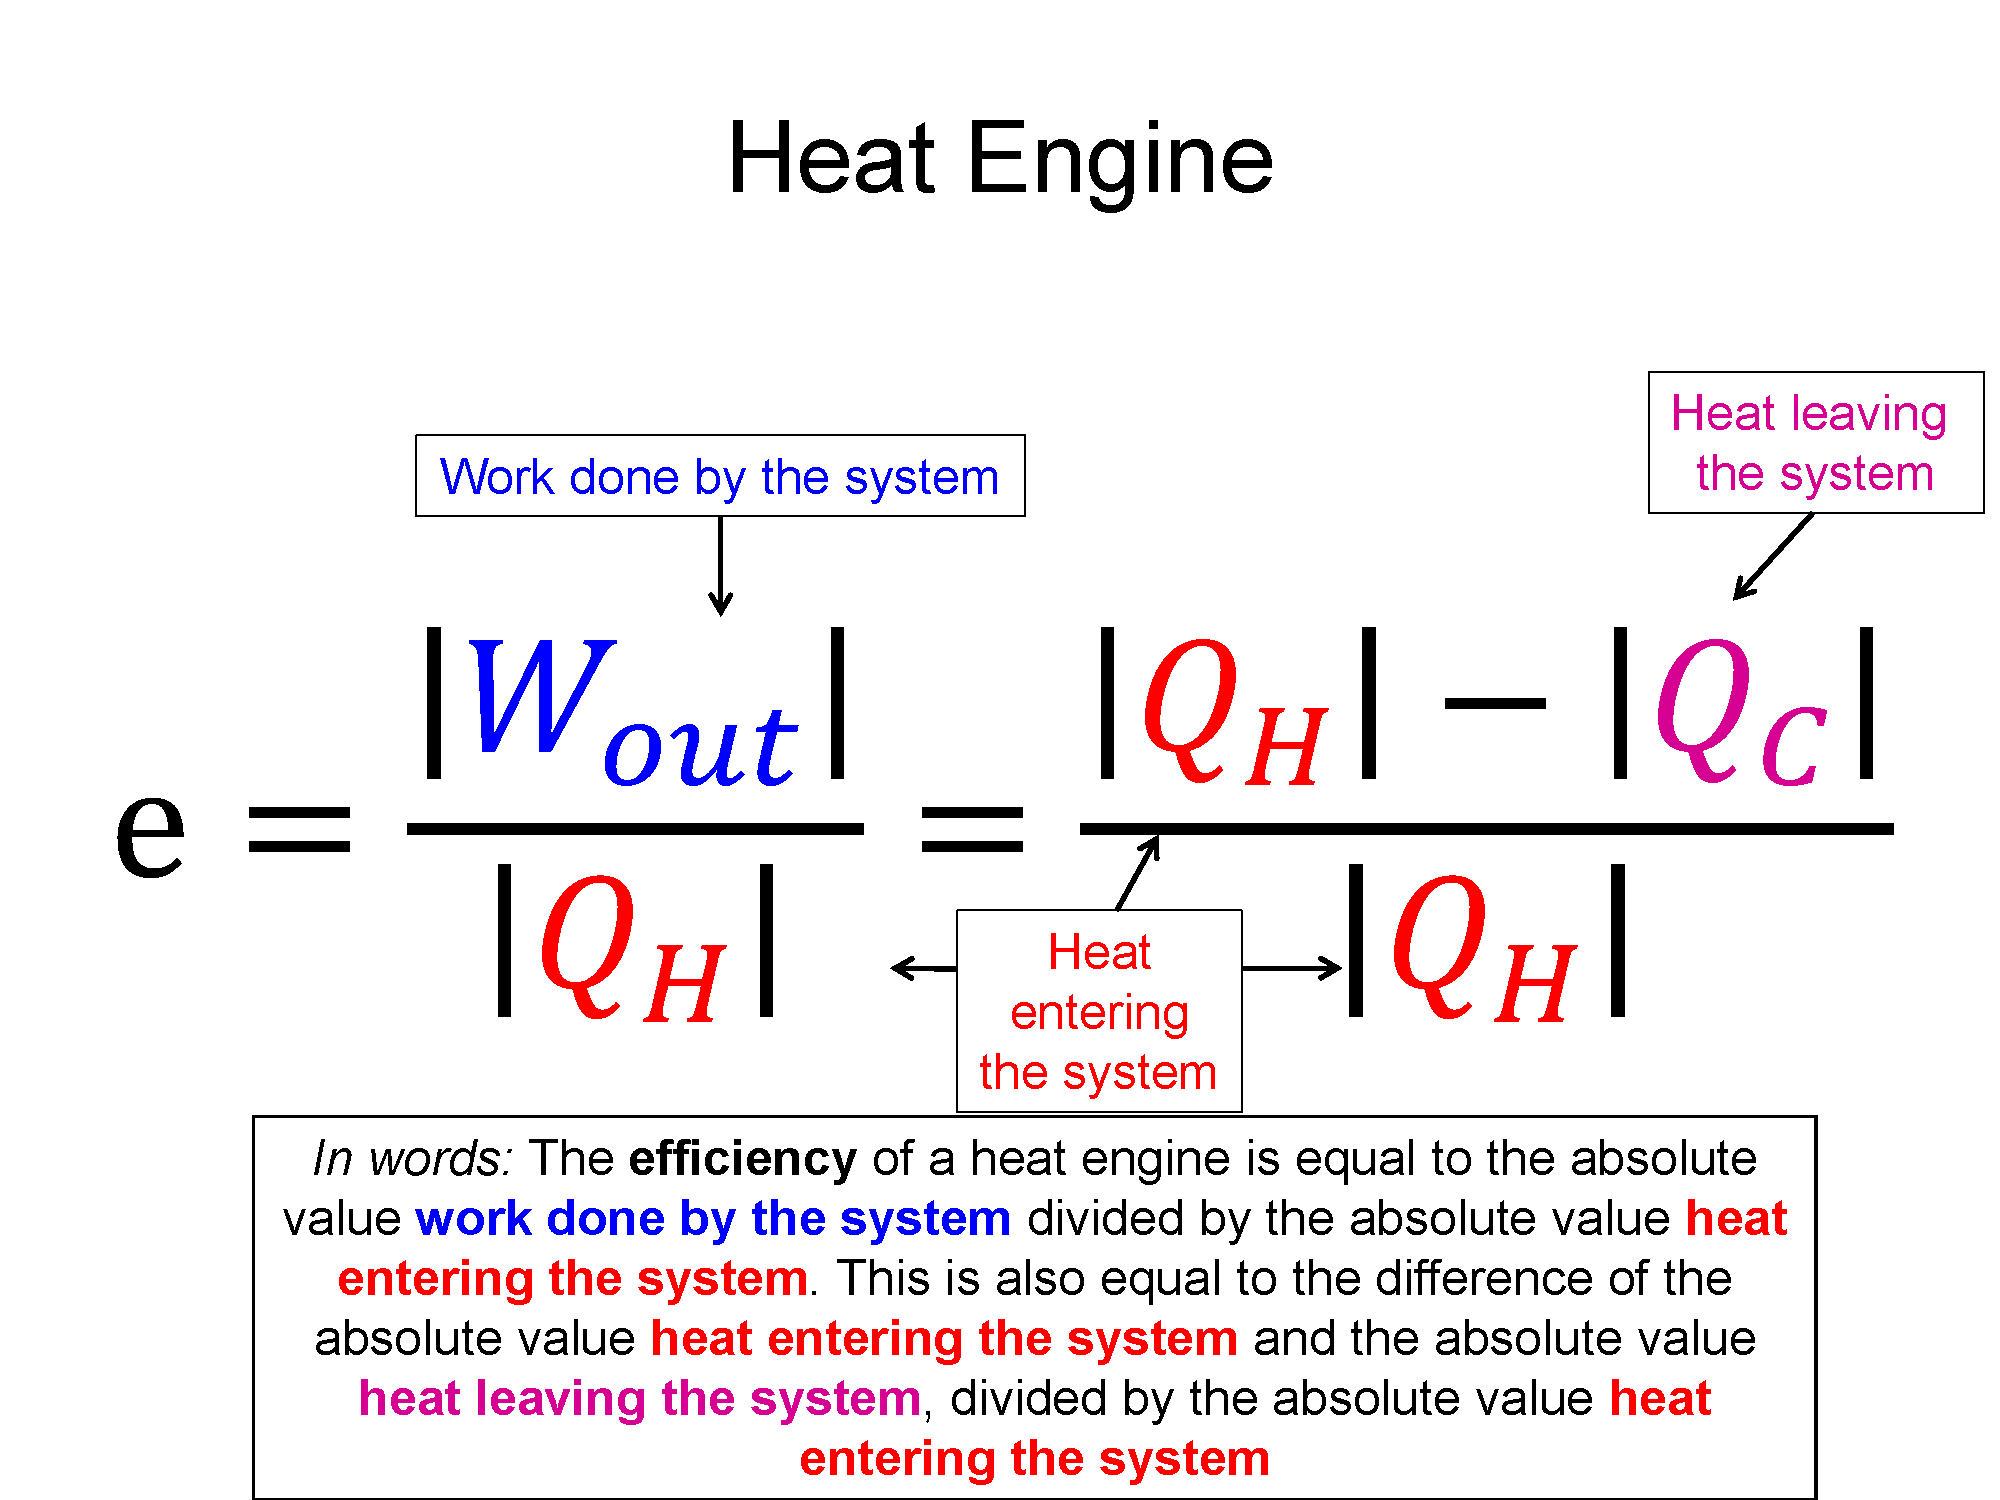
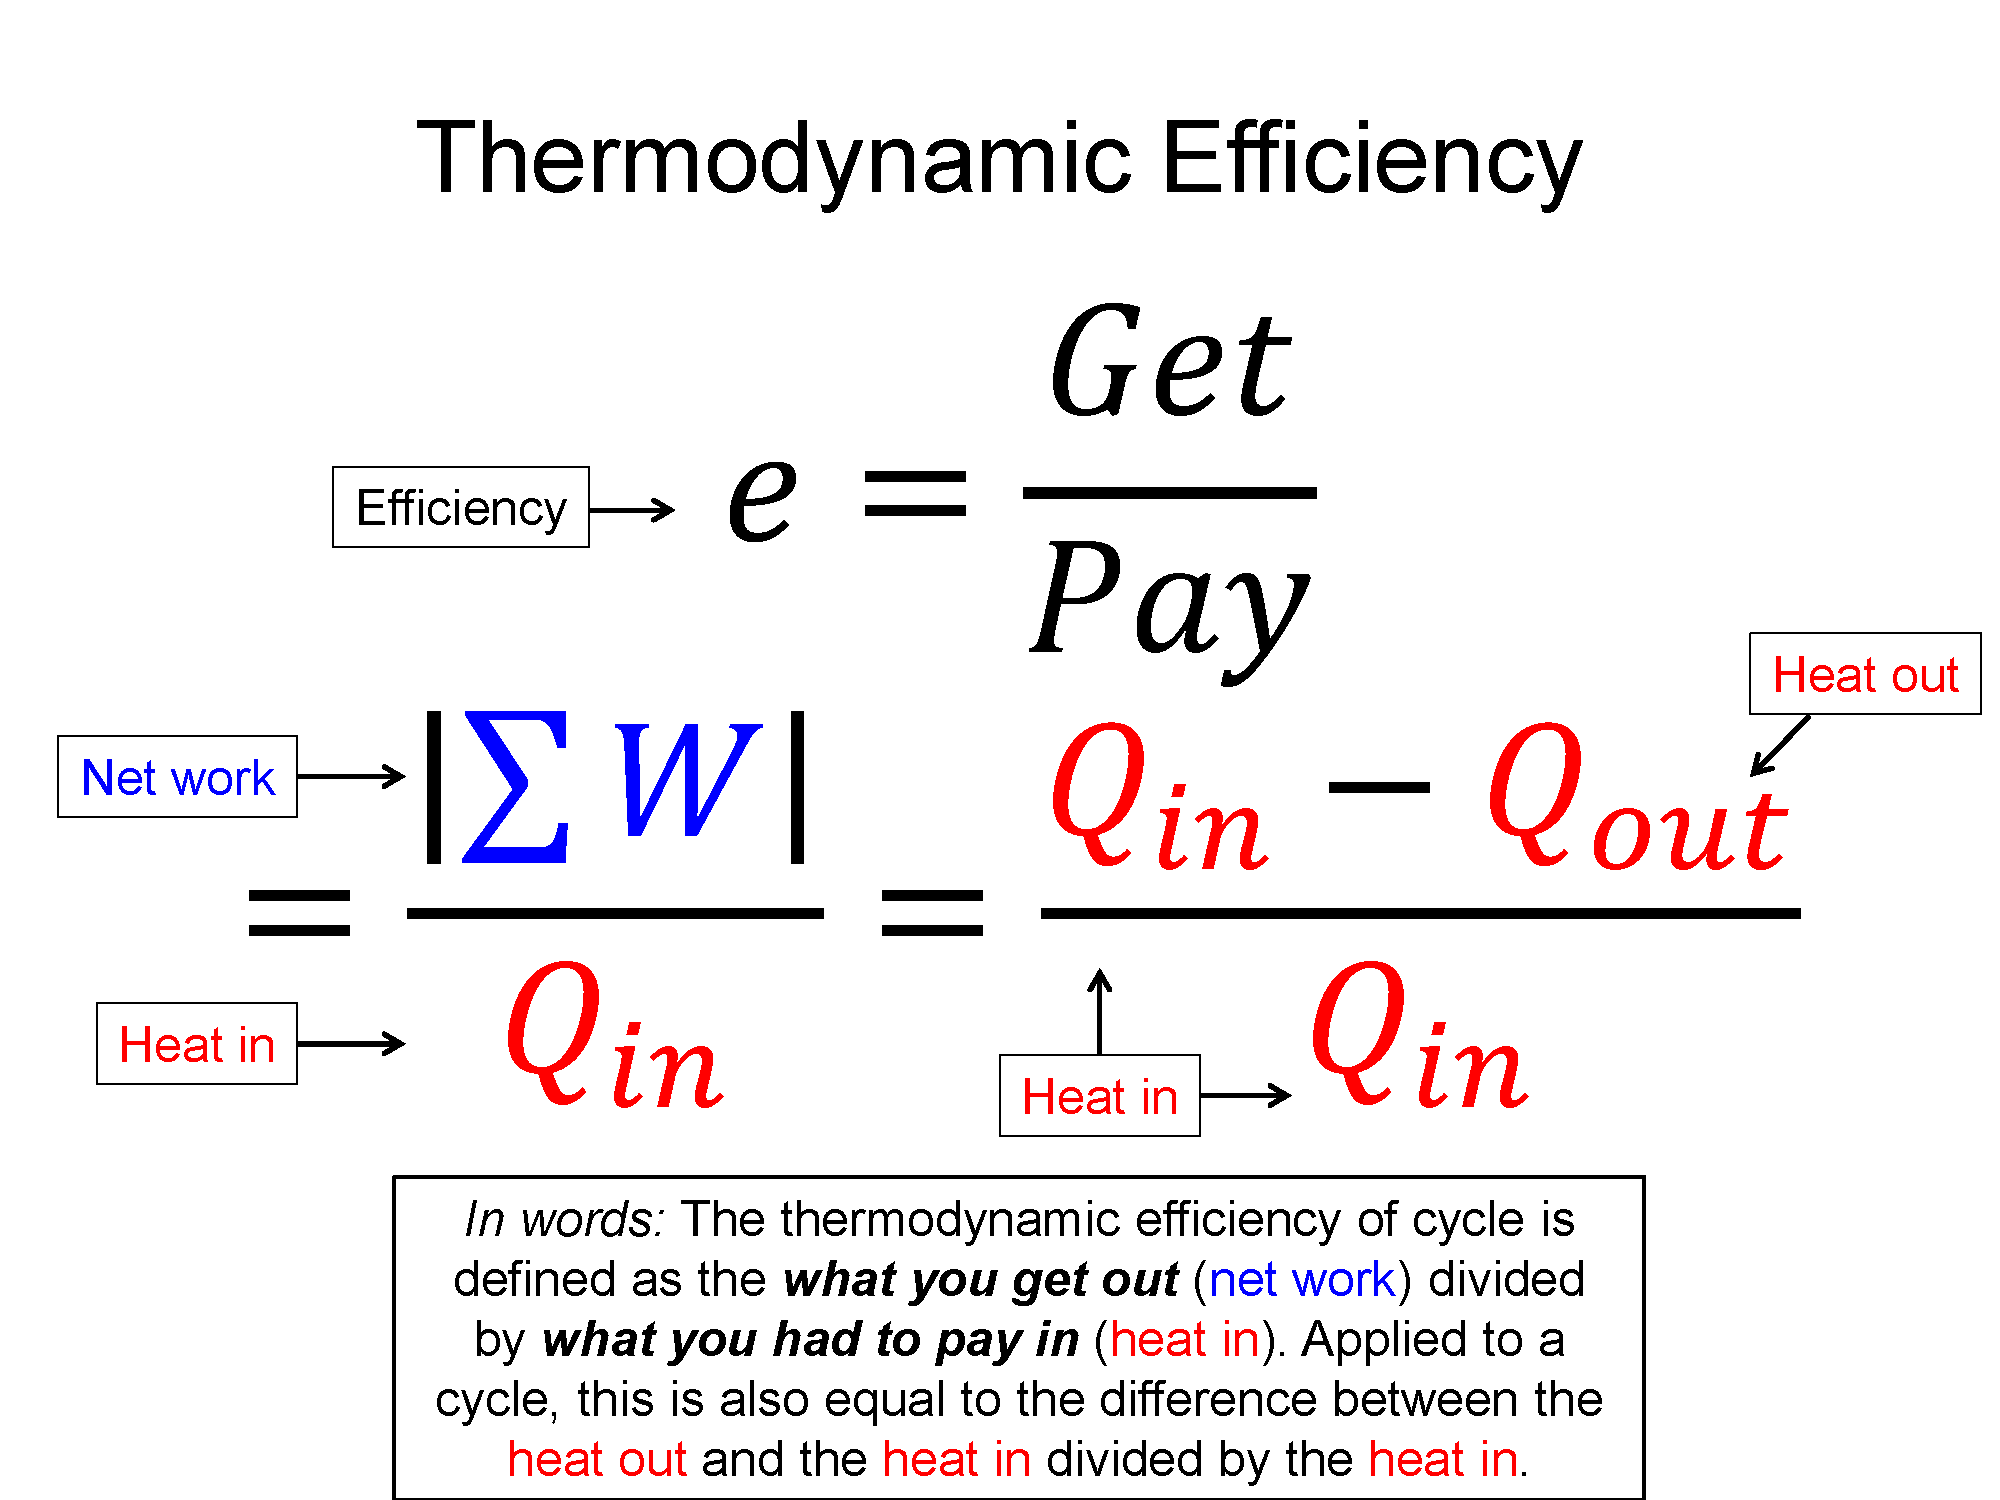
Efficiency: $ e = \frac{|\sum W|}{\sum Q_{in}}$

Isobaric

$\Delta P = 0$, then $\Delta V \propto \Delta t$

$W = P \Delta V$

Isothermal

$\Delta T = 0$, then $P \propto \frac{1}{V}$

$W = \frac{3}{2}nT ln(\frac{V_{f}}{V_{i}}))$

Adiabatic

$Q=0$, then $\Delta E = W$

Isochoric

$\Delta V = 0$ and $W=0$

Totale energy ($E$), Heat ($Q$), Work ($W$), Efficiency ($e$), Pressure ($P$), Volume ($V$), Time ($t$), Temperature ($T$),

Number of moles ($n$) 
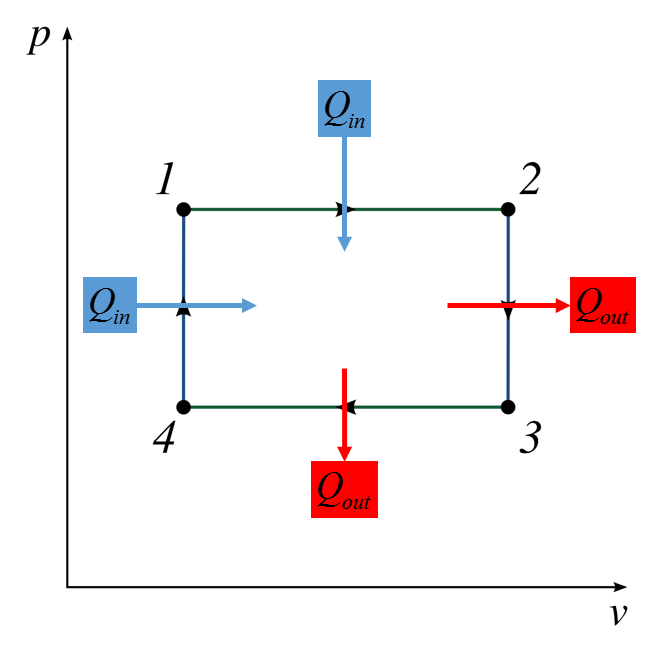

A representation with the words heat engine on the top. There is an equation that shows that the efficiency of a heat engine is equal to the absolute value work done by the system divided by the absolute value heat entering the system. This is also equal to the difference of the absolute value heat entering the system and the absolute value heat leaving the system, divided by the absolute value heat entering the system. This is also written in words below.


A representation with the words Carnot cycle on the top. There is an equation that shows that the theoretical maximum efficiency is equal to one minus the temperature of the cold reservoir divided by the temperature of the hot reservoir. This is also written in words below.


A representation with the words thermodynamic efficiency on the top. There is an equation that shows that the thermodynamic efficiency of cycle is defined as the what you get out (net work) divided by what you had to pay in (heat in). Applied to a cycle, this is also equal to the difference between the heat out and the heat in divided by the heat in. This is also written in words below.

Graphical

Graphical Representation describes the situation through use of plots and graphs.

1-2 Isobaric, 2-3 Isothermal

This is a P.V. diagram with four points on the graph that are in the shape of a rectangle with arrows going clockwise. There are also four arrows showing the direction of heat either into or out of the system.


Descriptive

Descriptive Representation describes the physical phenomena with words and annotations.

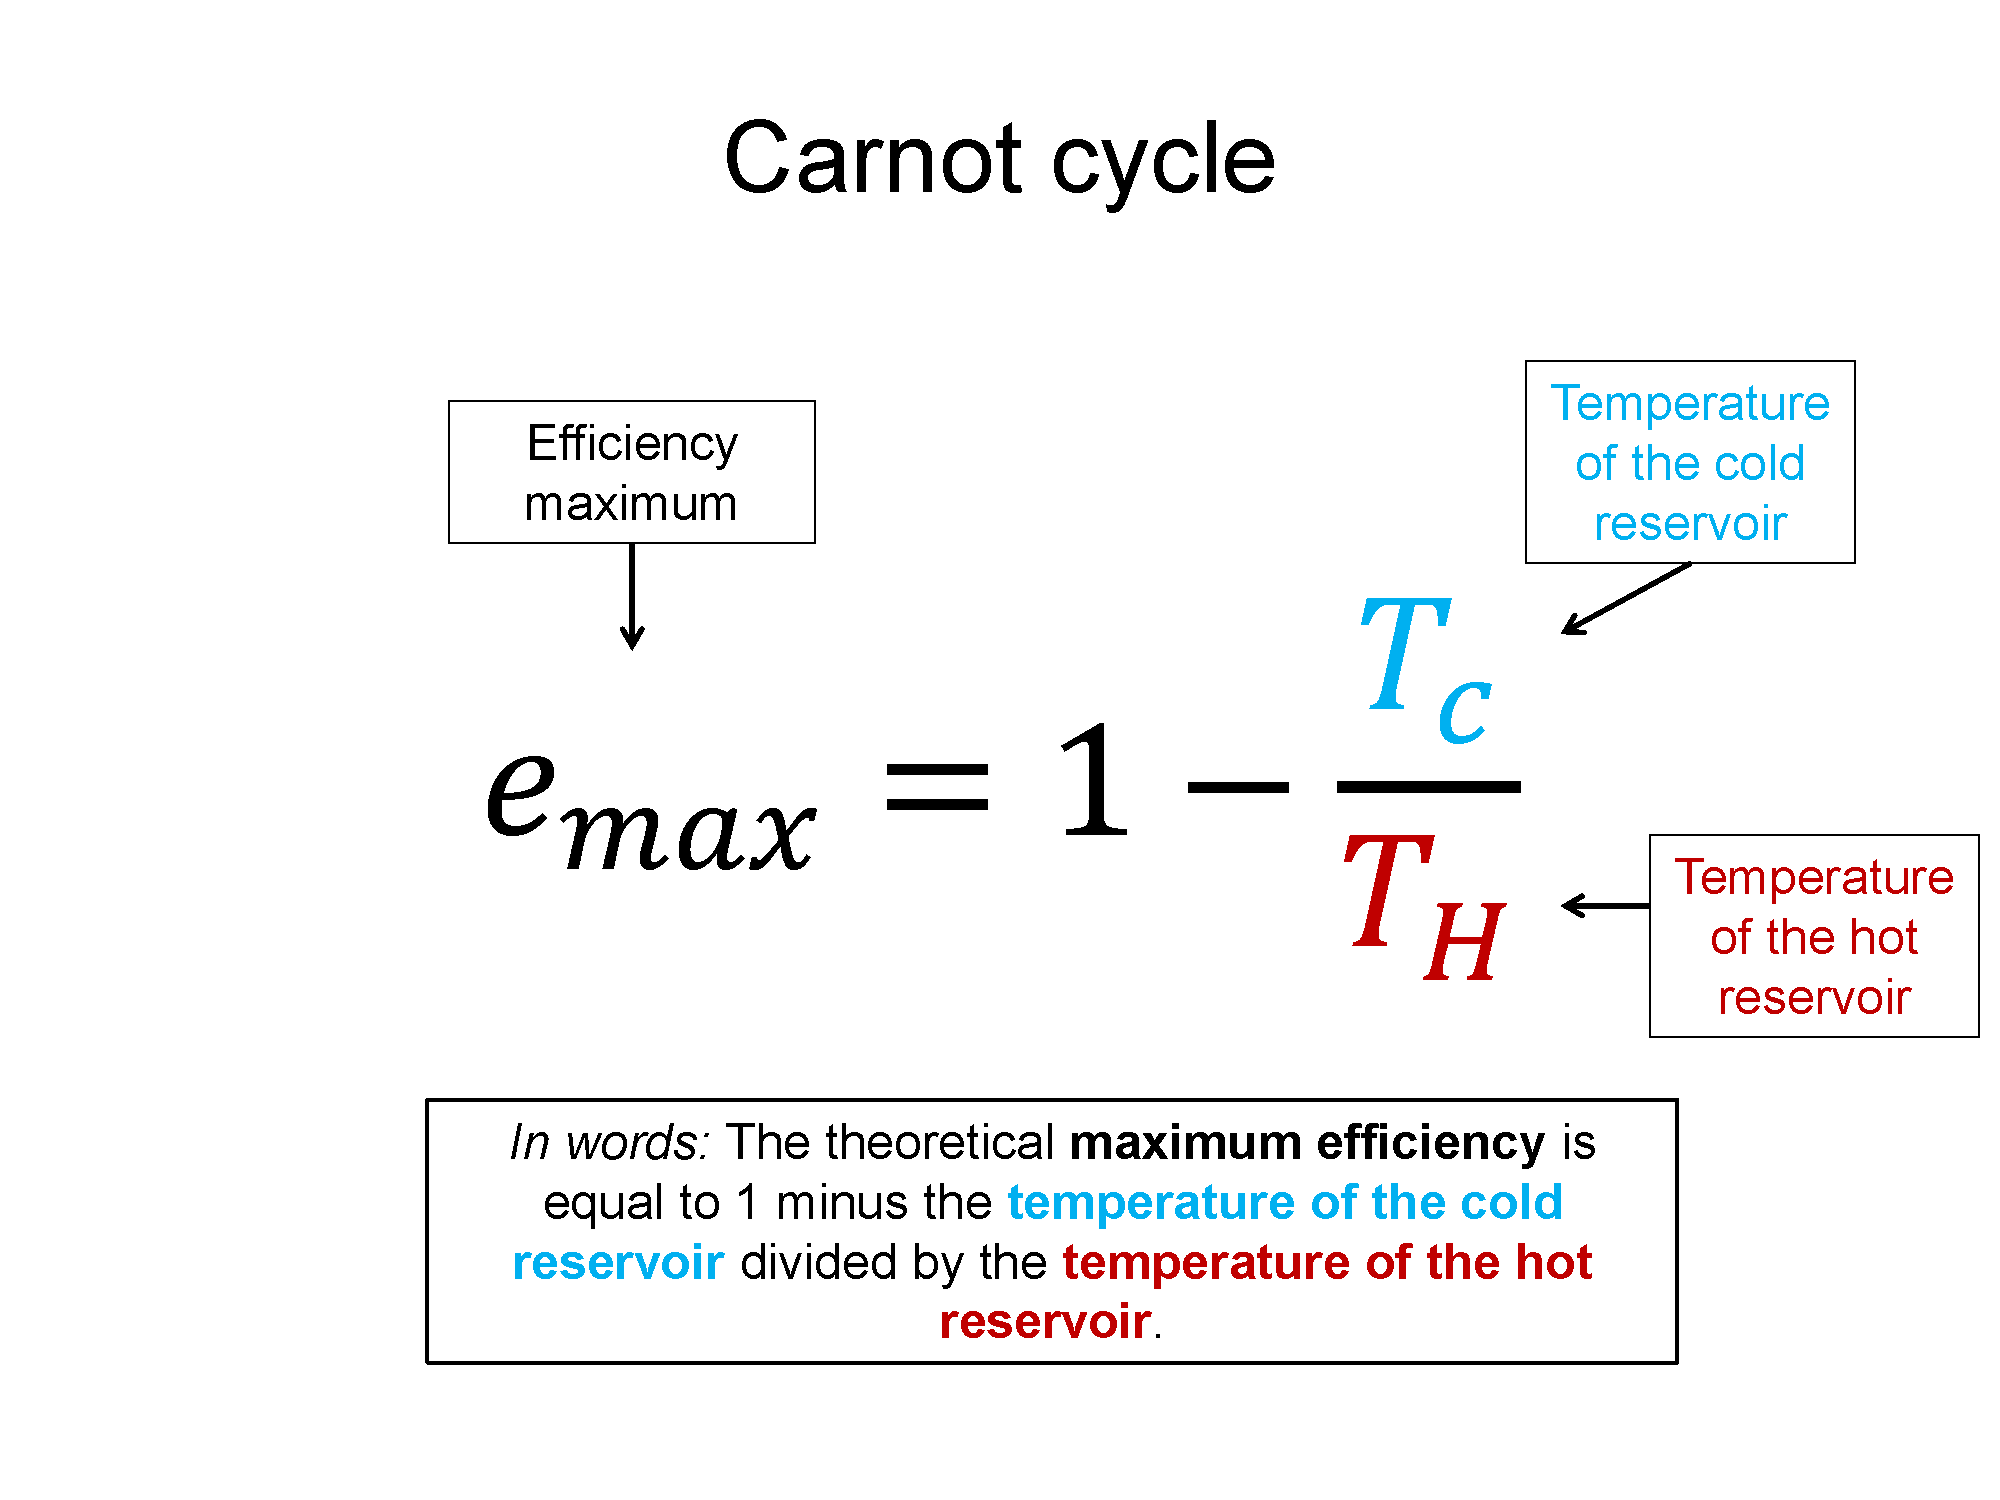
Here is a link to a description of the Carnot Cycle from Hyper Physics. This is an ideal description of a perfectly efficient cycle. 

Hyper Physics Icon

Experimental

Experimental Representation examines a physical phenomena through observations and data measurement.

The Experimental Representation for this would be to build a Stirling engine which is an application of the Carnot cycle. 

Arrow that takes you back to the Fundamentals section