We use thermodynamic machines to do our bidding in modern society. Combustion engines, refrigerators, even your cell phone can be studied as a thermodynamic system under going cycles. The analysis of such a system culminates our study of thermo because it incorporates many of the features learned about - ideal gas law, 1st and 2nd law of thermo, and the kinetic theory of gases are all relevant.
A 4-stroke engine is a perfect example of using a thermodynamics cycle to get useful work.
https://www.youtube.com/watch?v=XoL-t_Yh7Ck
Pre-lecture Study Resources
Watch the pre-lecture videos and read through the OpenStax text before doing the pre-lecture homework or attending class.
BoxSand Videos
Required Videos
Suggested Supplemental Videos
none
Learning Objectives
Summary
Summary
Atomistic Goals
Students will be able to...
BoxSand Introduction
Thermo | Heat Engines
Thermodynamic cycles of gases are used everywhere in modern society to do our bidding. From diesel engines to refrigerators, we use expansions and contractions of gases, along with work and heat exchanges and the 1st law, to solve problems with thermodynamic machines. What is also nice about studying thermo cycles is that they are an ideal place to put almost all the thermo we have learned into one problem.
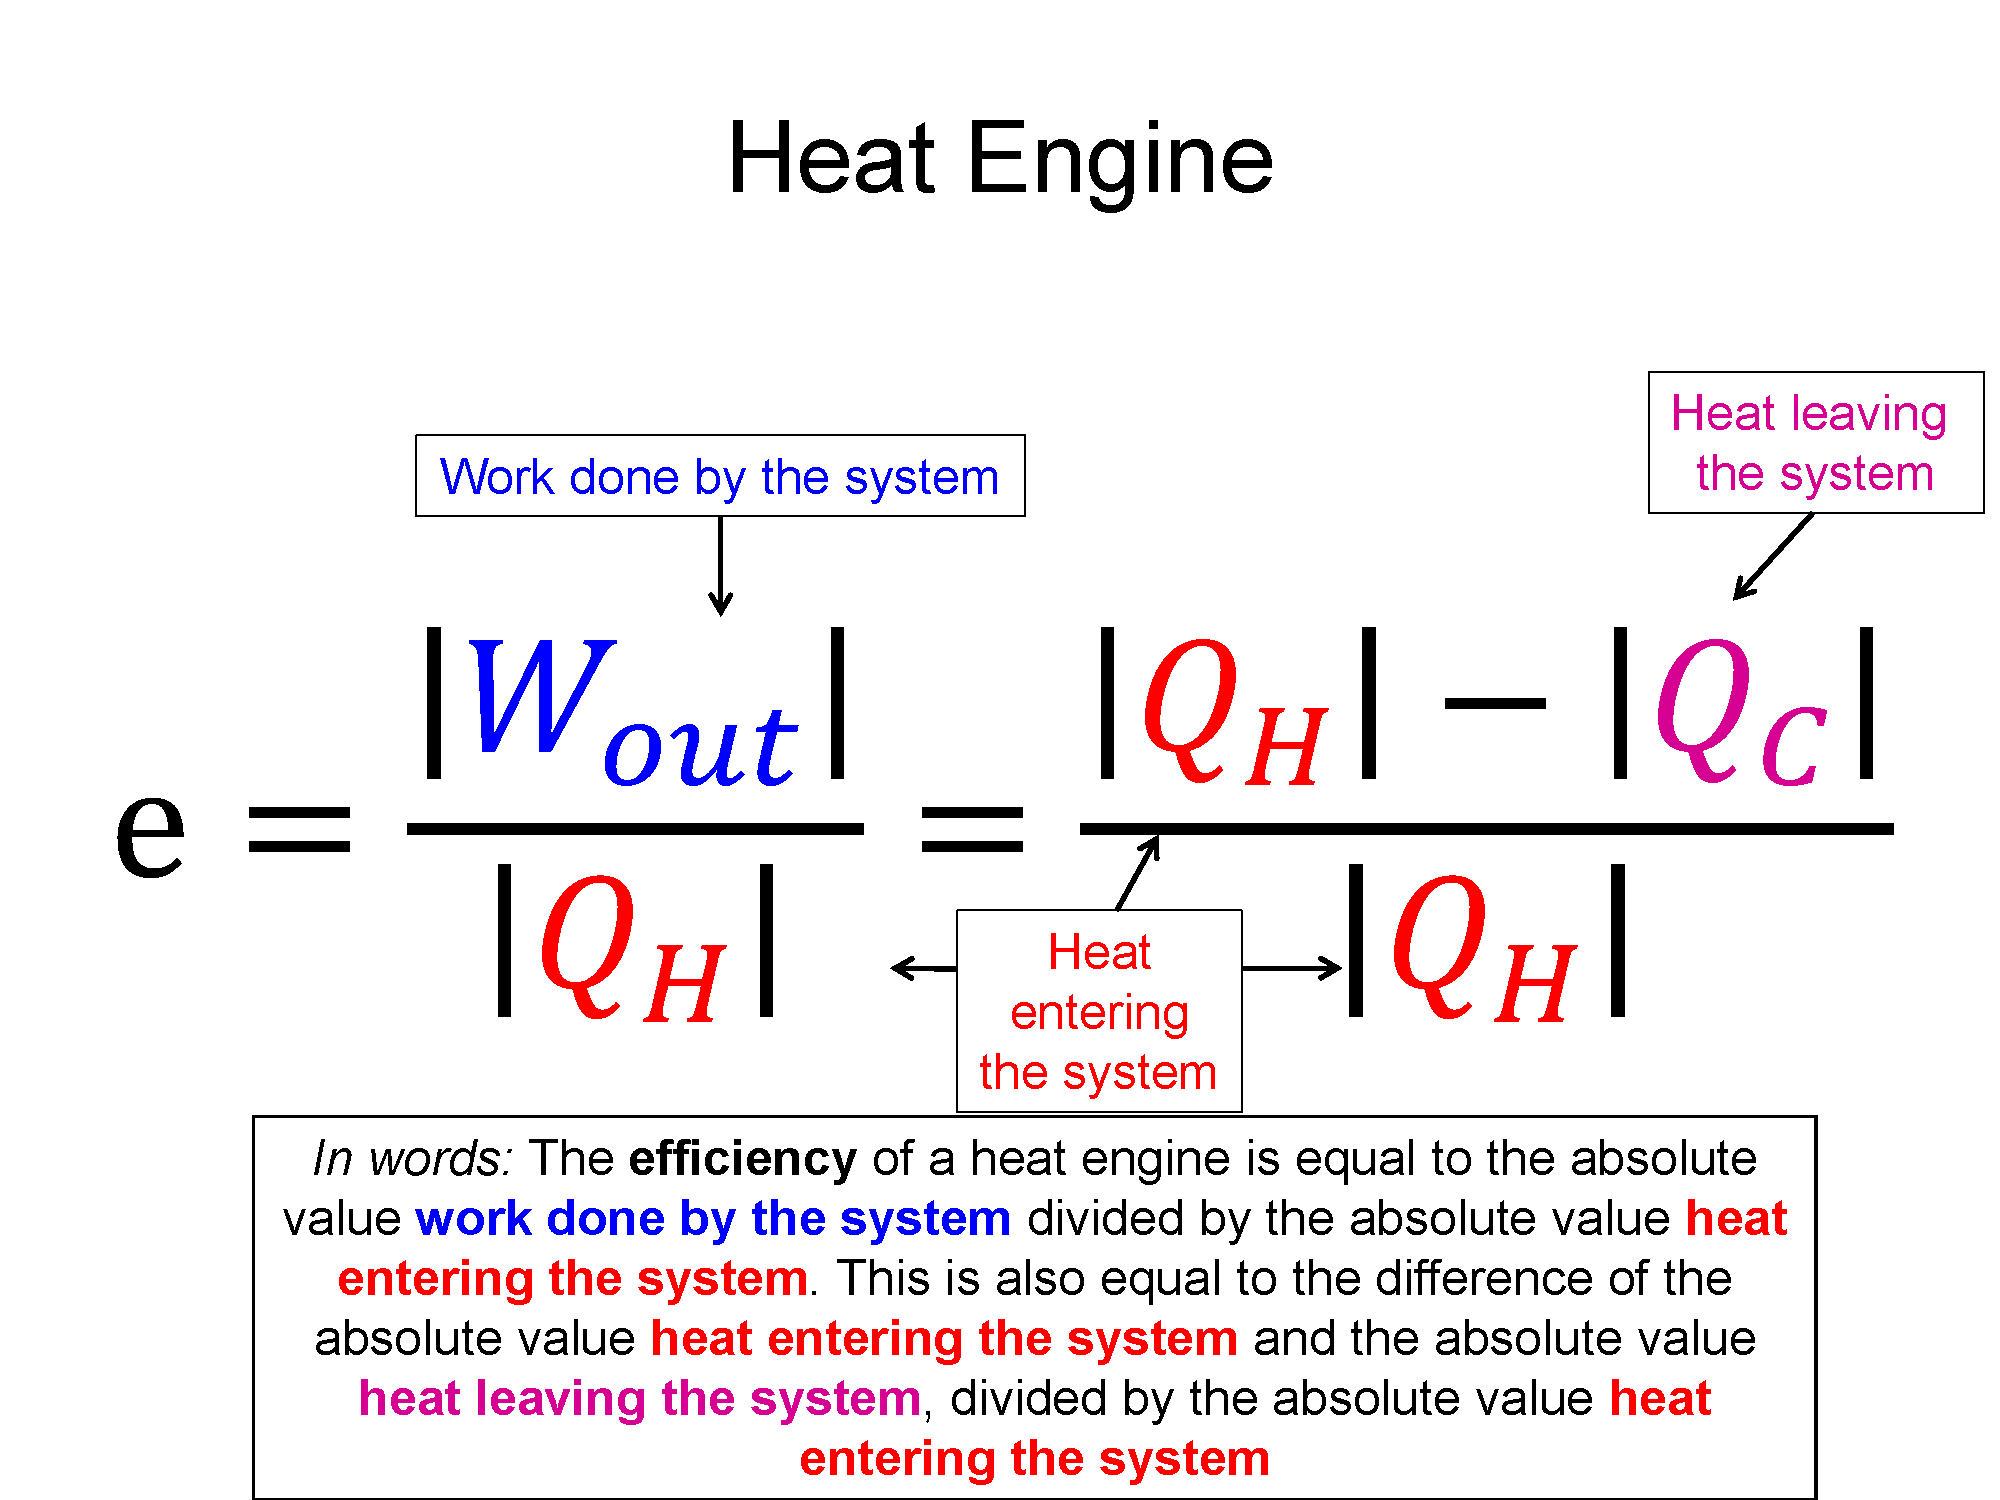
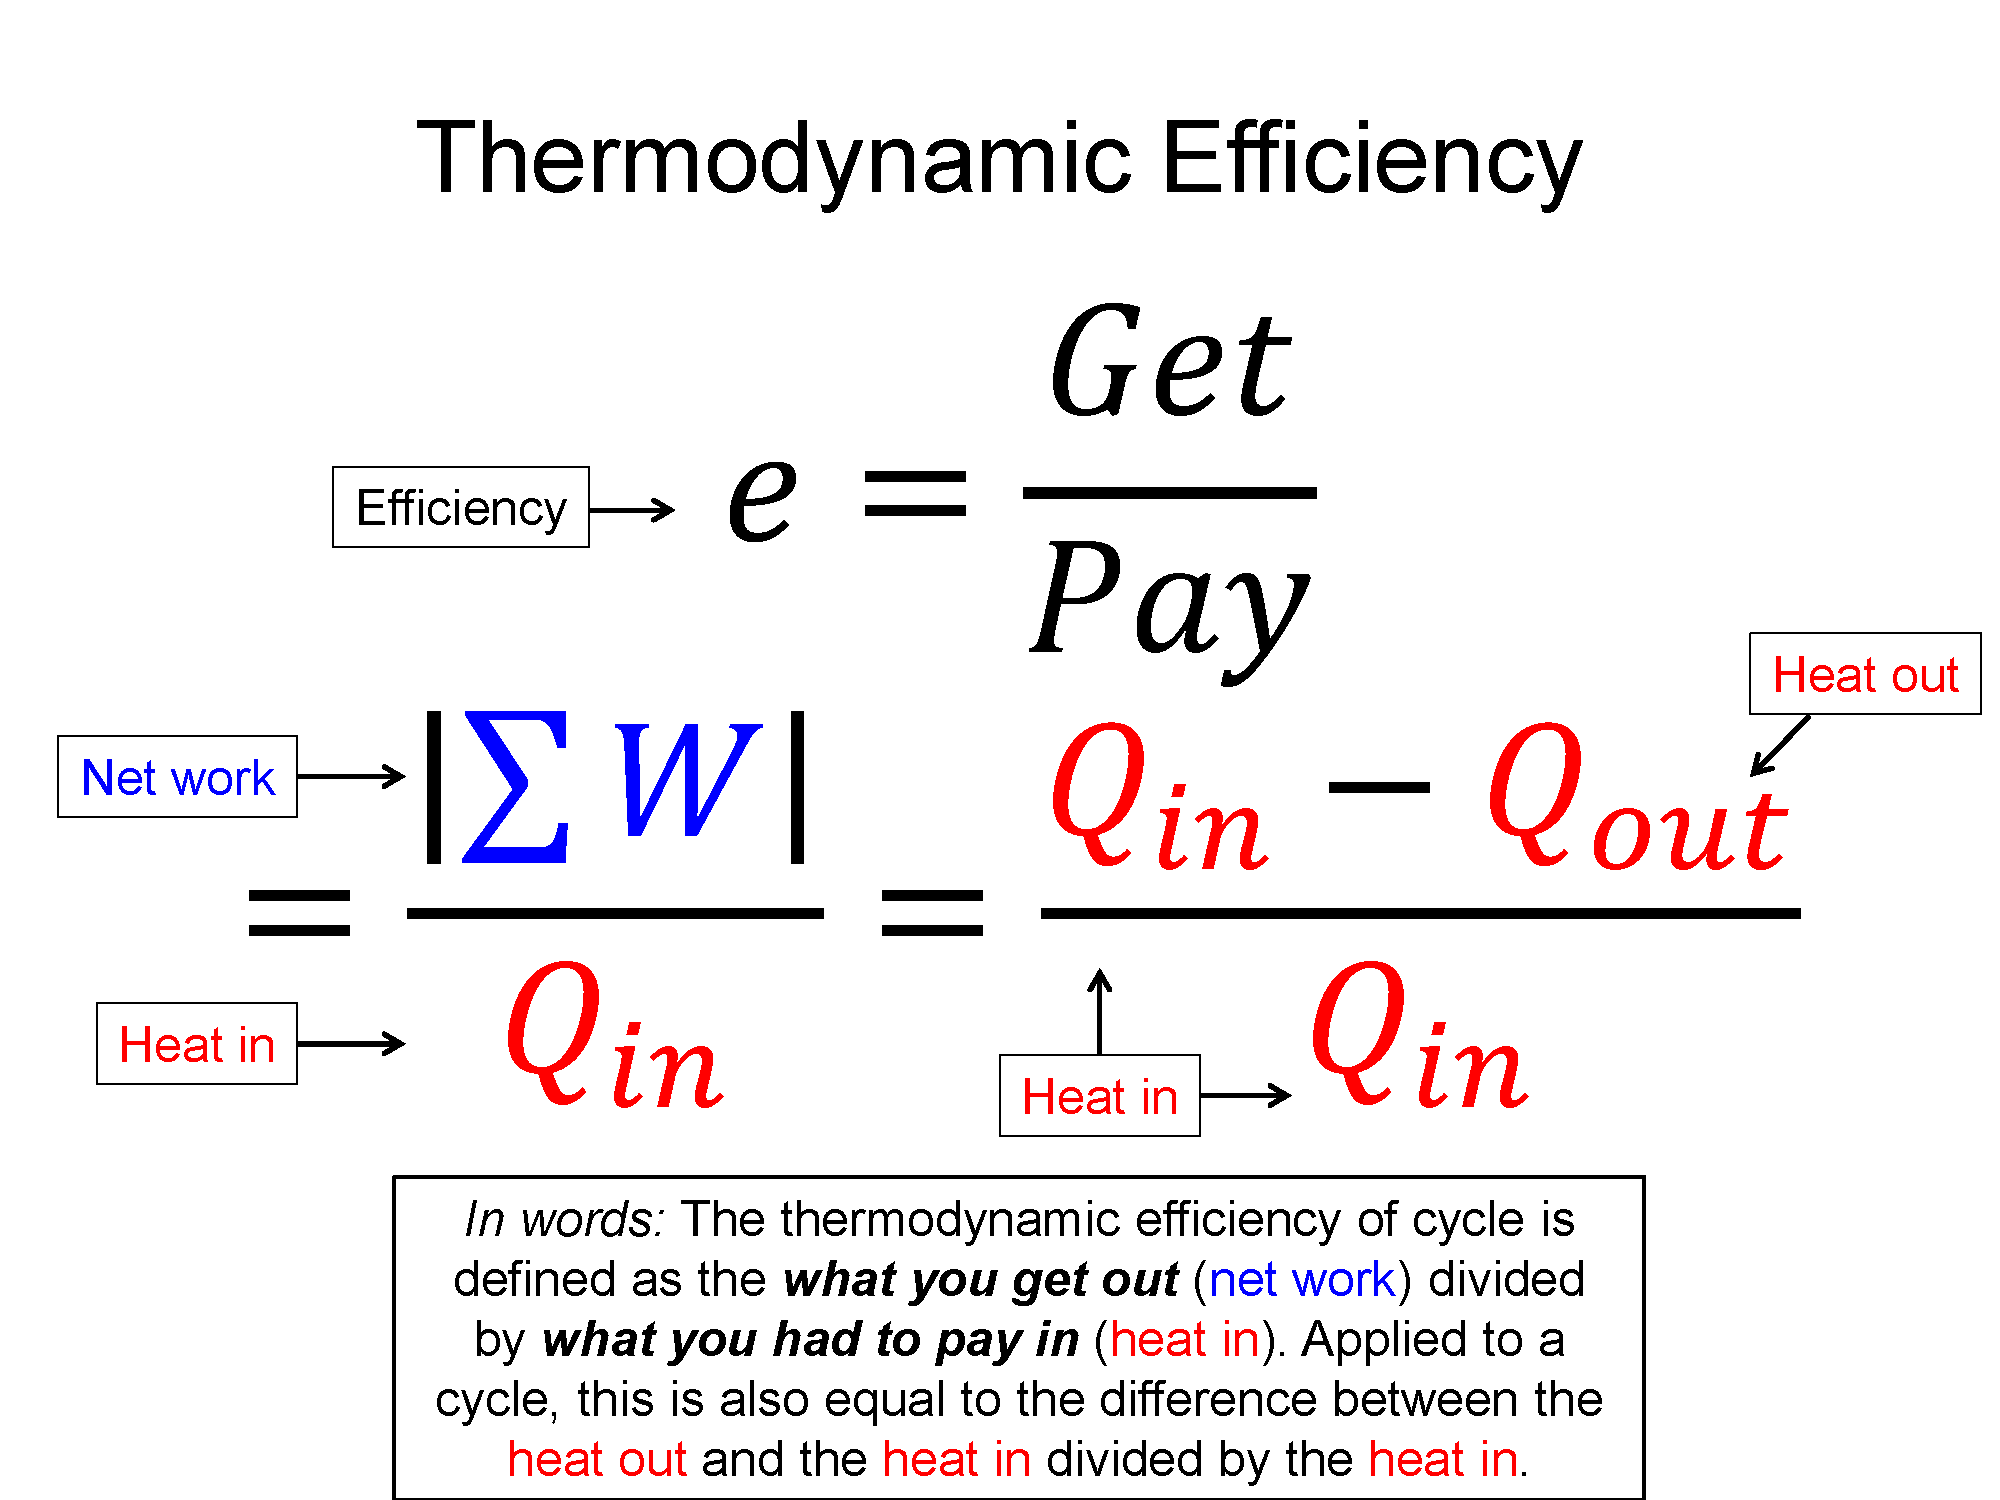
One type of cyclical process is a heat engine, sometimes called a power cycle. These are cycles where there is a net work out of the system, a steam engine being an example. One of important quantities in this case is the thermodynamic efficiency. In the example of the steam engine, you take stored chemical potential energy in the coal/wood and using a thermodynamic process of heat transfer (burning) you are able to get useful work out (train starts moving). The thermodynamic efficiency of cycle is defined as the what you get out (net work) divided by what you had to pay in (heat in).
$e = \frac{what-you-get-out}{what-you-pay-in}=\frac{|\sum W|}{\sum Q_{in}}$, where $Q_{in}$ is all the positive Q's
using the 1st law $\Delta E_{th}=Q+W$, the efficiency can also be written as $e=\frac{Q_{in} - Q_{out}}{Q_{in}}$
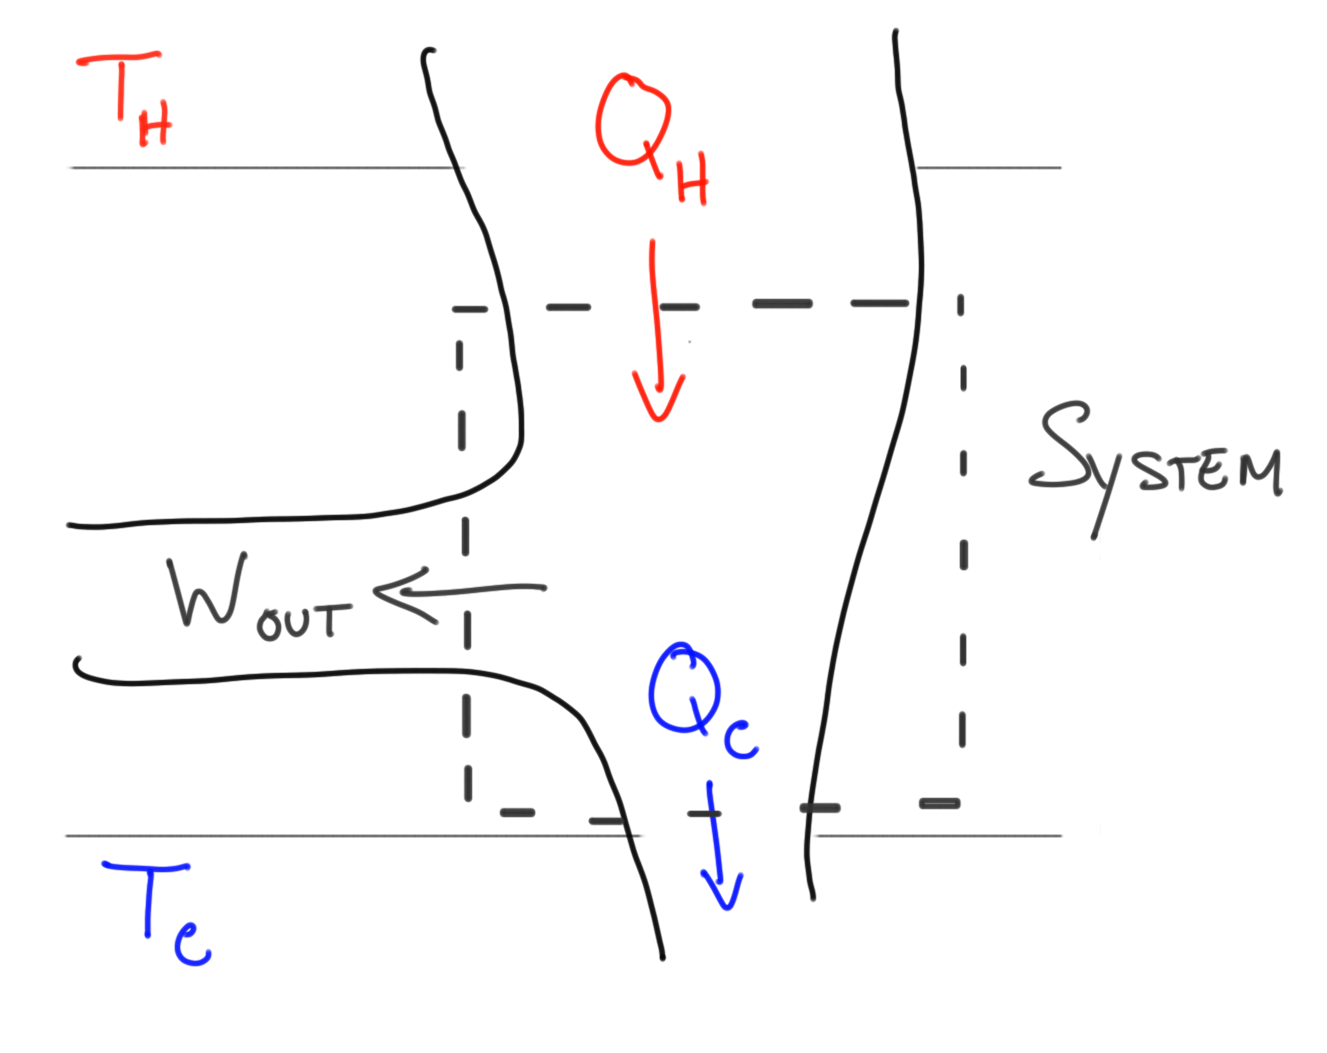
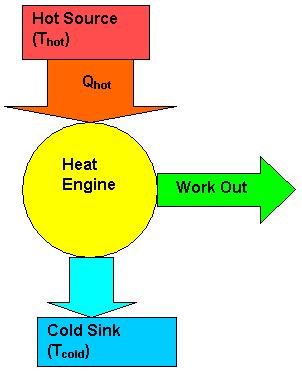
One way to visualize a heat engine is to use a Sankey diagram where arrows represent the energy transfers.
All heat engines ultimately operate between a hot and cold reservoir. As heat flows from the hot to the cold reservoir, useful work is extracted. Some energy though always has to be exhausted to the cold temperature reservoir, entropy is the driver of this feature. The 2nd law of thermo drives this process and forces there to never be a perfectly efficient process - heat cannot be 100% converted into work. One way to accept this fact is to imagine the diagram above flowing all the heat from the hot reservoir out to work. If that was the case the system would no longer be in contact with the cold temp reservoir and then what would be driving the heat transfer?
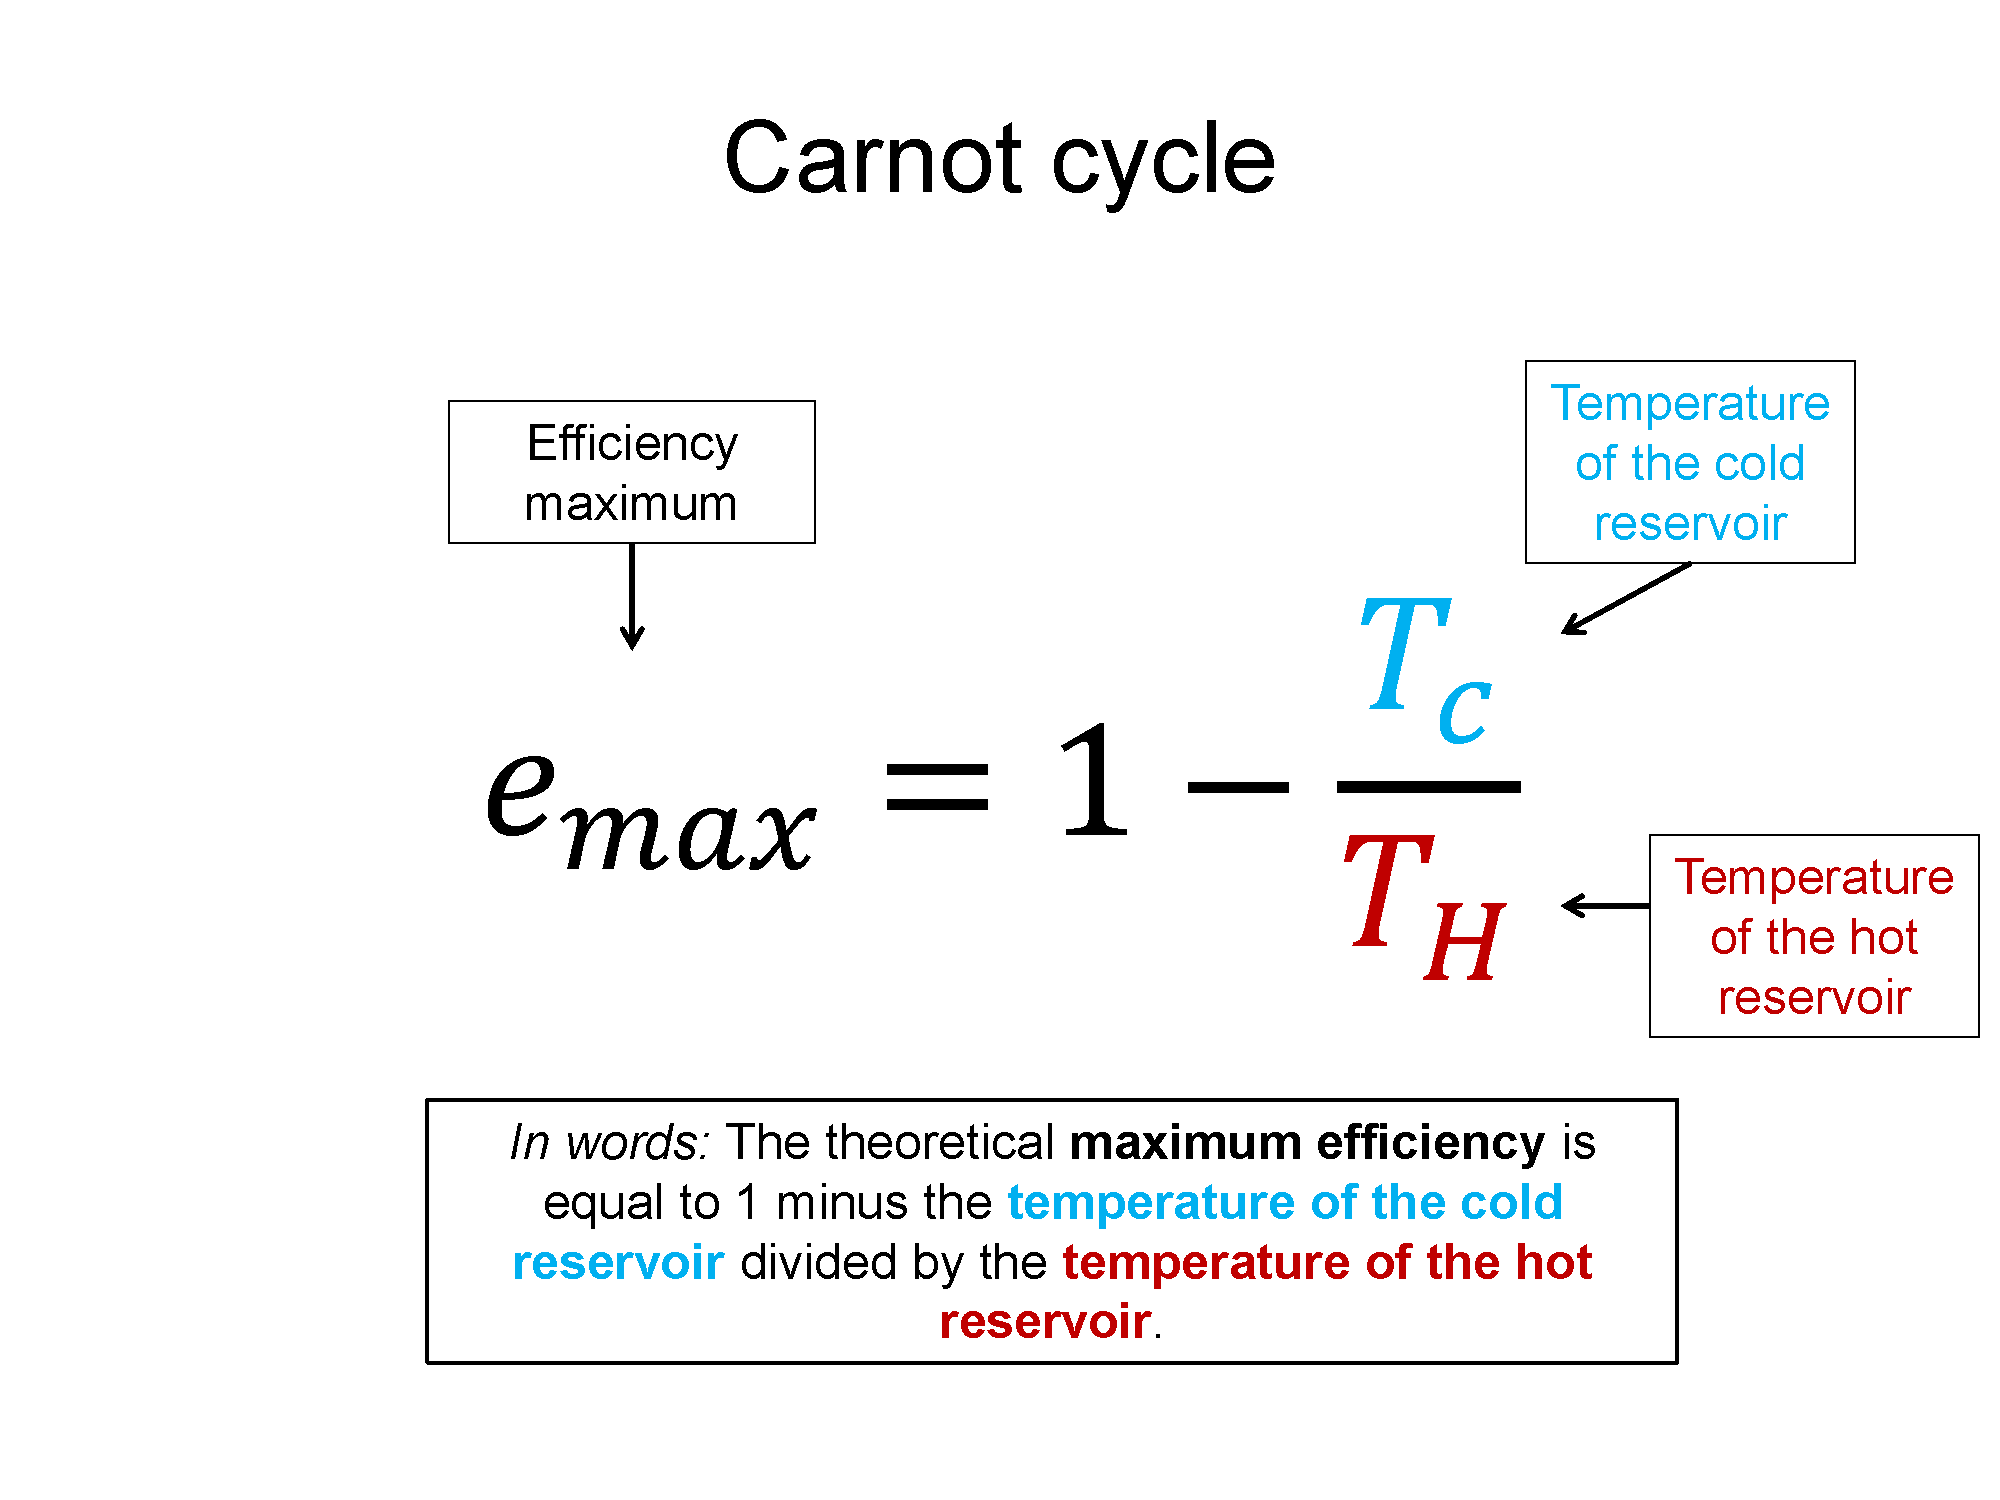
There is such a thing as a theoretically maximum efficient cycle. That cycle is called a Carnot cycle and the max efficiency can be written in terms of the temperature of the hot and cold reservoirs.
$e_{max} = 1-\frac{T_C}{T_H}$
Key Equations and Infographics
Now, take a look at the pre-lecture reading and videos below.
OpenStax Reading
OpenStax Section 15.3 | Introduction to the Second Law of Thermodynamics: Heat Engines and Their Efficiency
![]()
OpenStax Section 15.4 | Carnot’s Perfect Heat Engine: The Second Law of Thermodynamics Restated
![]()
OpenStax Section 15.5 | Applications of Thermodynamics: Heat Pumps and Refrigerators
![]()
Additional Study Resources
Use the supplemental resources below to support your post-lecture study.
YouTube Videos
Heat engine with PV diagram
https://www.youtube.com/watch?v=yu_3ZBhpNH8
Heat Engines explained
https://www.youtube.com/watch?v=PcccJz3AFrA
https://www.youtube.com/watch?v=O7TSo_up1Dw
Other Resources
This link will take you to the repository of other content related resources .
![]()
Simulations
This simulation allows you to explore a thermodynamic cycle with a PV Diagram. You can move any/all the points or sides of the cycle and see the impact on the Work, Energy, and Energy:
![]()
For additional simulations on this subject, visit the simulations repository.
![]()
Demos
For additional demos involving this subject, visit the demo repository
![]()
History
Oh no, we haven't been able to write up a history overview for this topic. If you'd like to contribute, contact the director of BoxSand, KC Walsh (walshke@oregonstate.edu).
Physics Fun
Smarter Everyday explains the workings of a perfect example of a thermodynamics system, an engine.
Other Resources
Here is a HyperPhysics page talking about PV-Diagrams and their ability to explore/explain engines:
![]()
Boston University's page on thermodynamic cycles,
![]()
![]()
Resource Repository
This link will take you to the repository of other content related resources .
![]()
Problem Solving Guide
Use the Tips and Tricks below to support your post-lecture study.
Assumptions
There are a LOT of things going on in analyzing a thermodynamic cycle. Here are some things that are always true to help you:
Remember the names of processes and tie them to their meaning. Iso- is a prefix that means "same", if it is there, that means the word that follows it is held constant in that process. Isothermal means process with constant temperature, isobaric means process with constant pressure, isochoric means process with constant volume. Also remember the shapes that go with each (check out the bakc of the physics survival sheet for this section for the most useful table for these processes: Survival Sheet.
There are a number of easily identifiable 0's that show up when analyzing thermodynamic cycles, here are the most frequent ones:
1) Delta Eth (change in thermal energy) for a cycle that returns to where it starts is always 0!
2) Delta Eth for an Isothermal process is always 0! This always means for an isothermal process W = -Q!
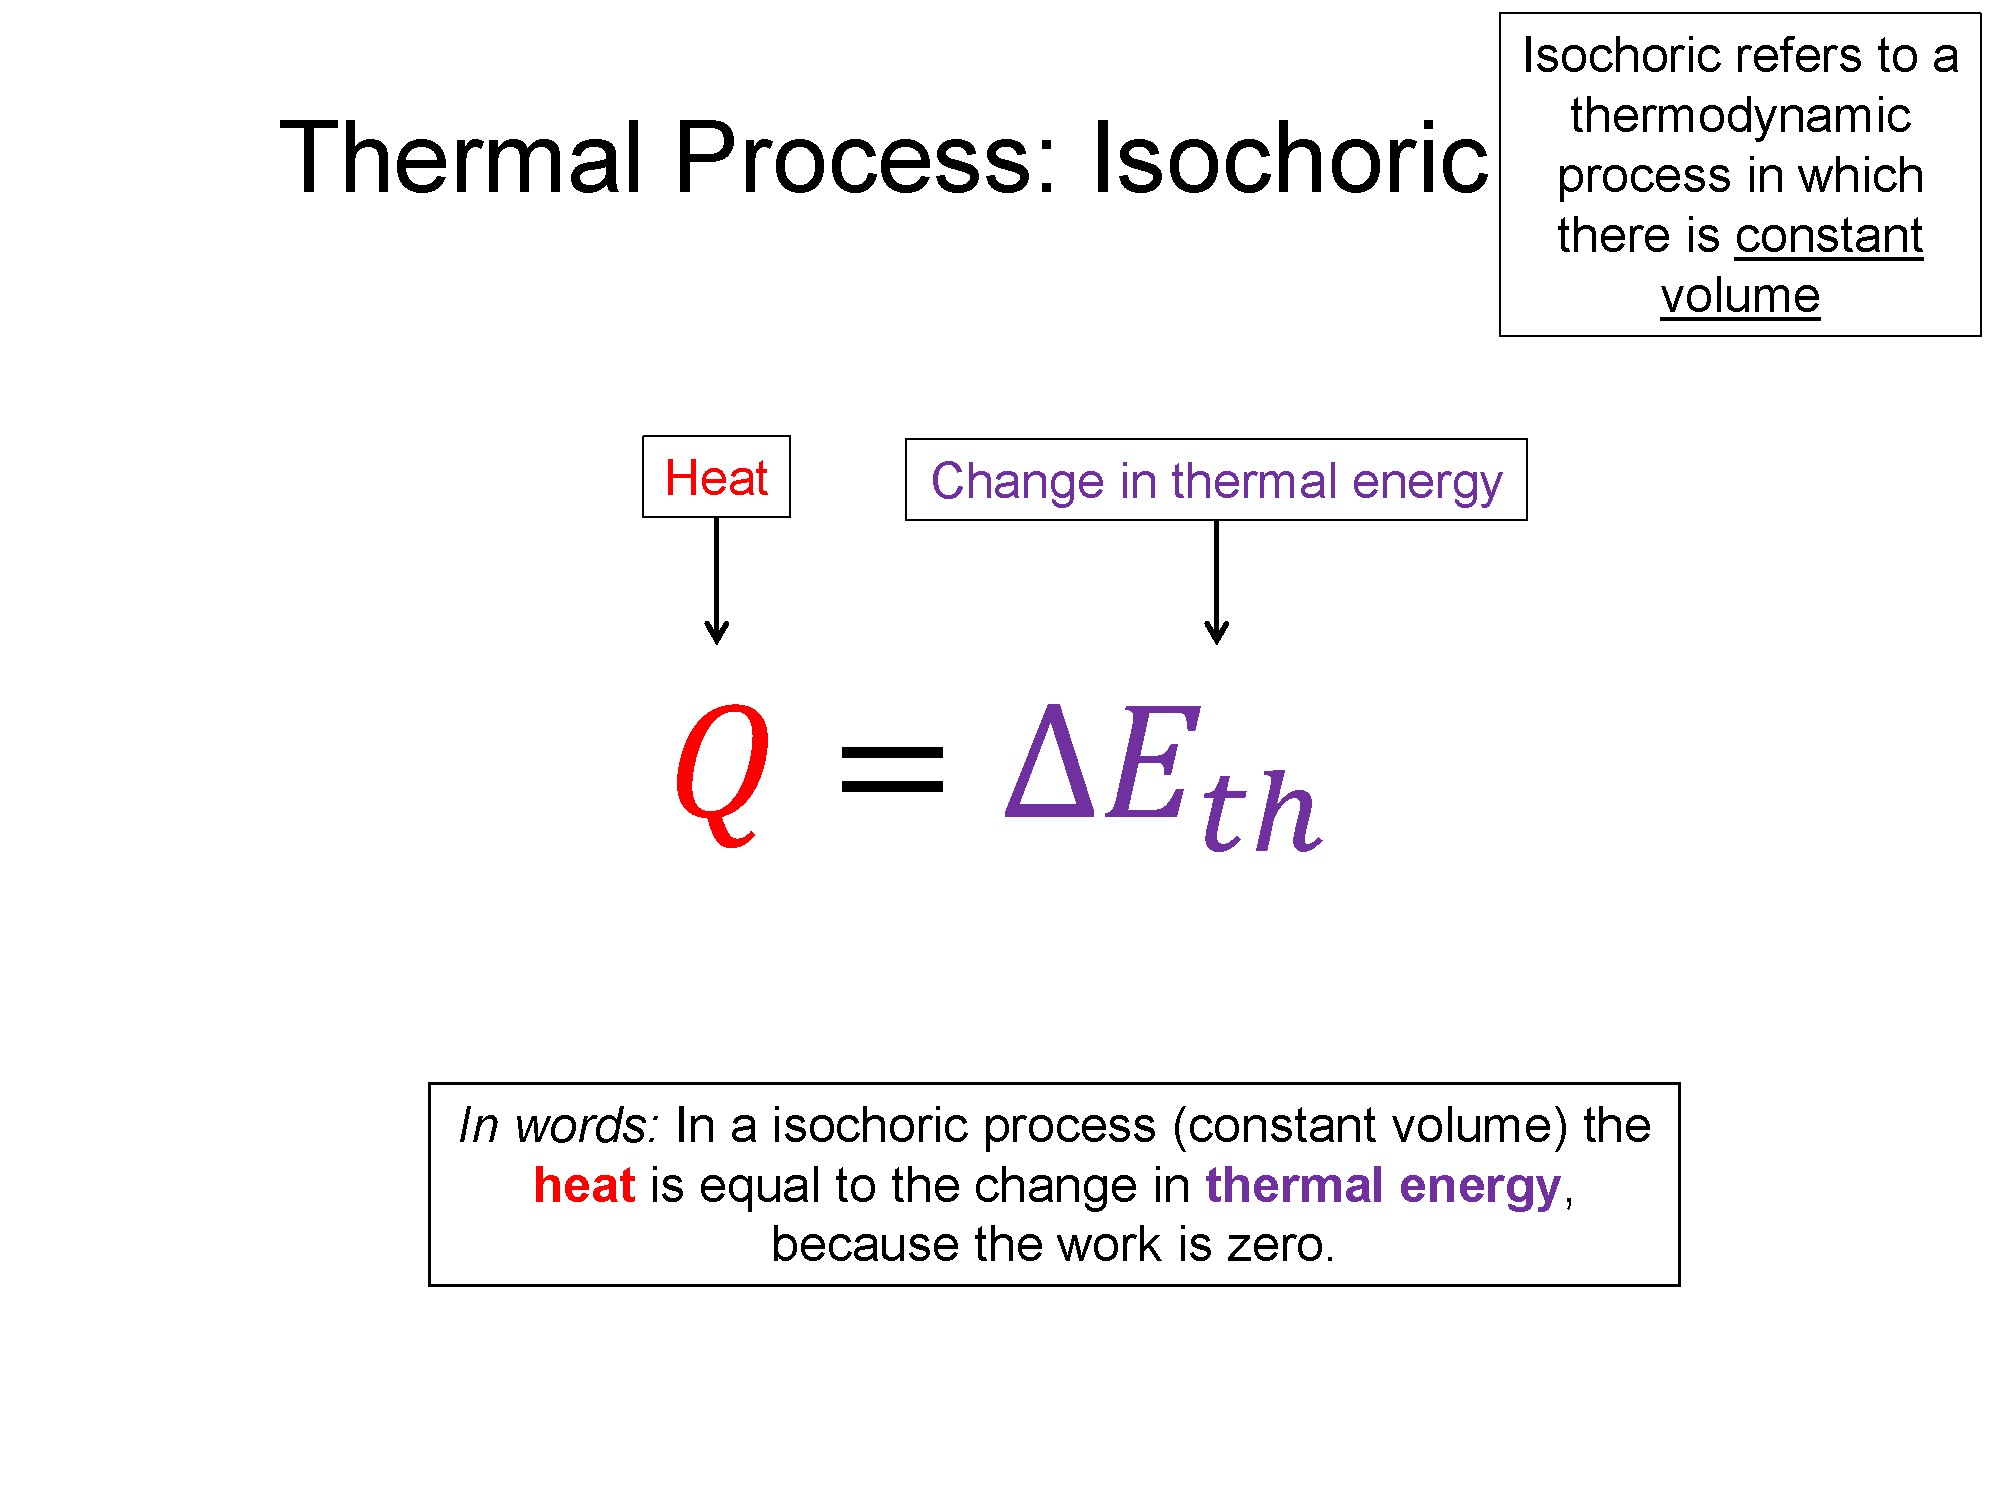
3) Work (W) for a isochoric process is always 0 (vertical line with no area underneath on a PV diagram means W = 0)!
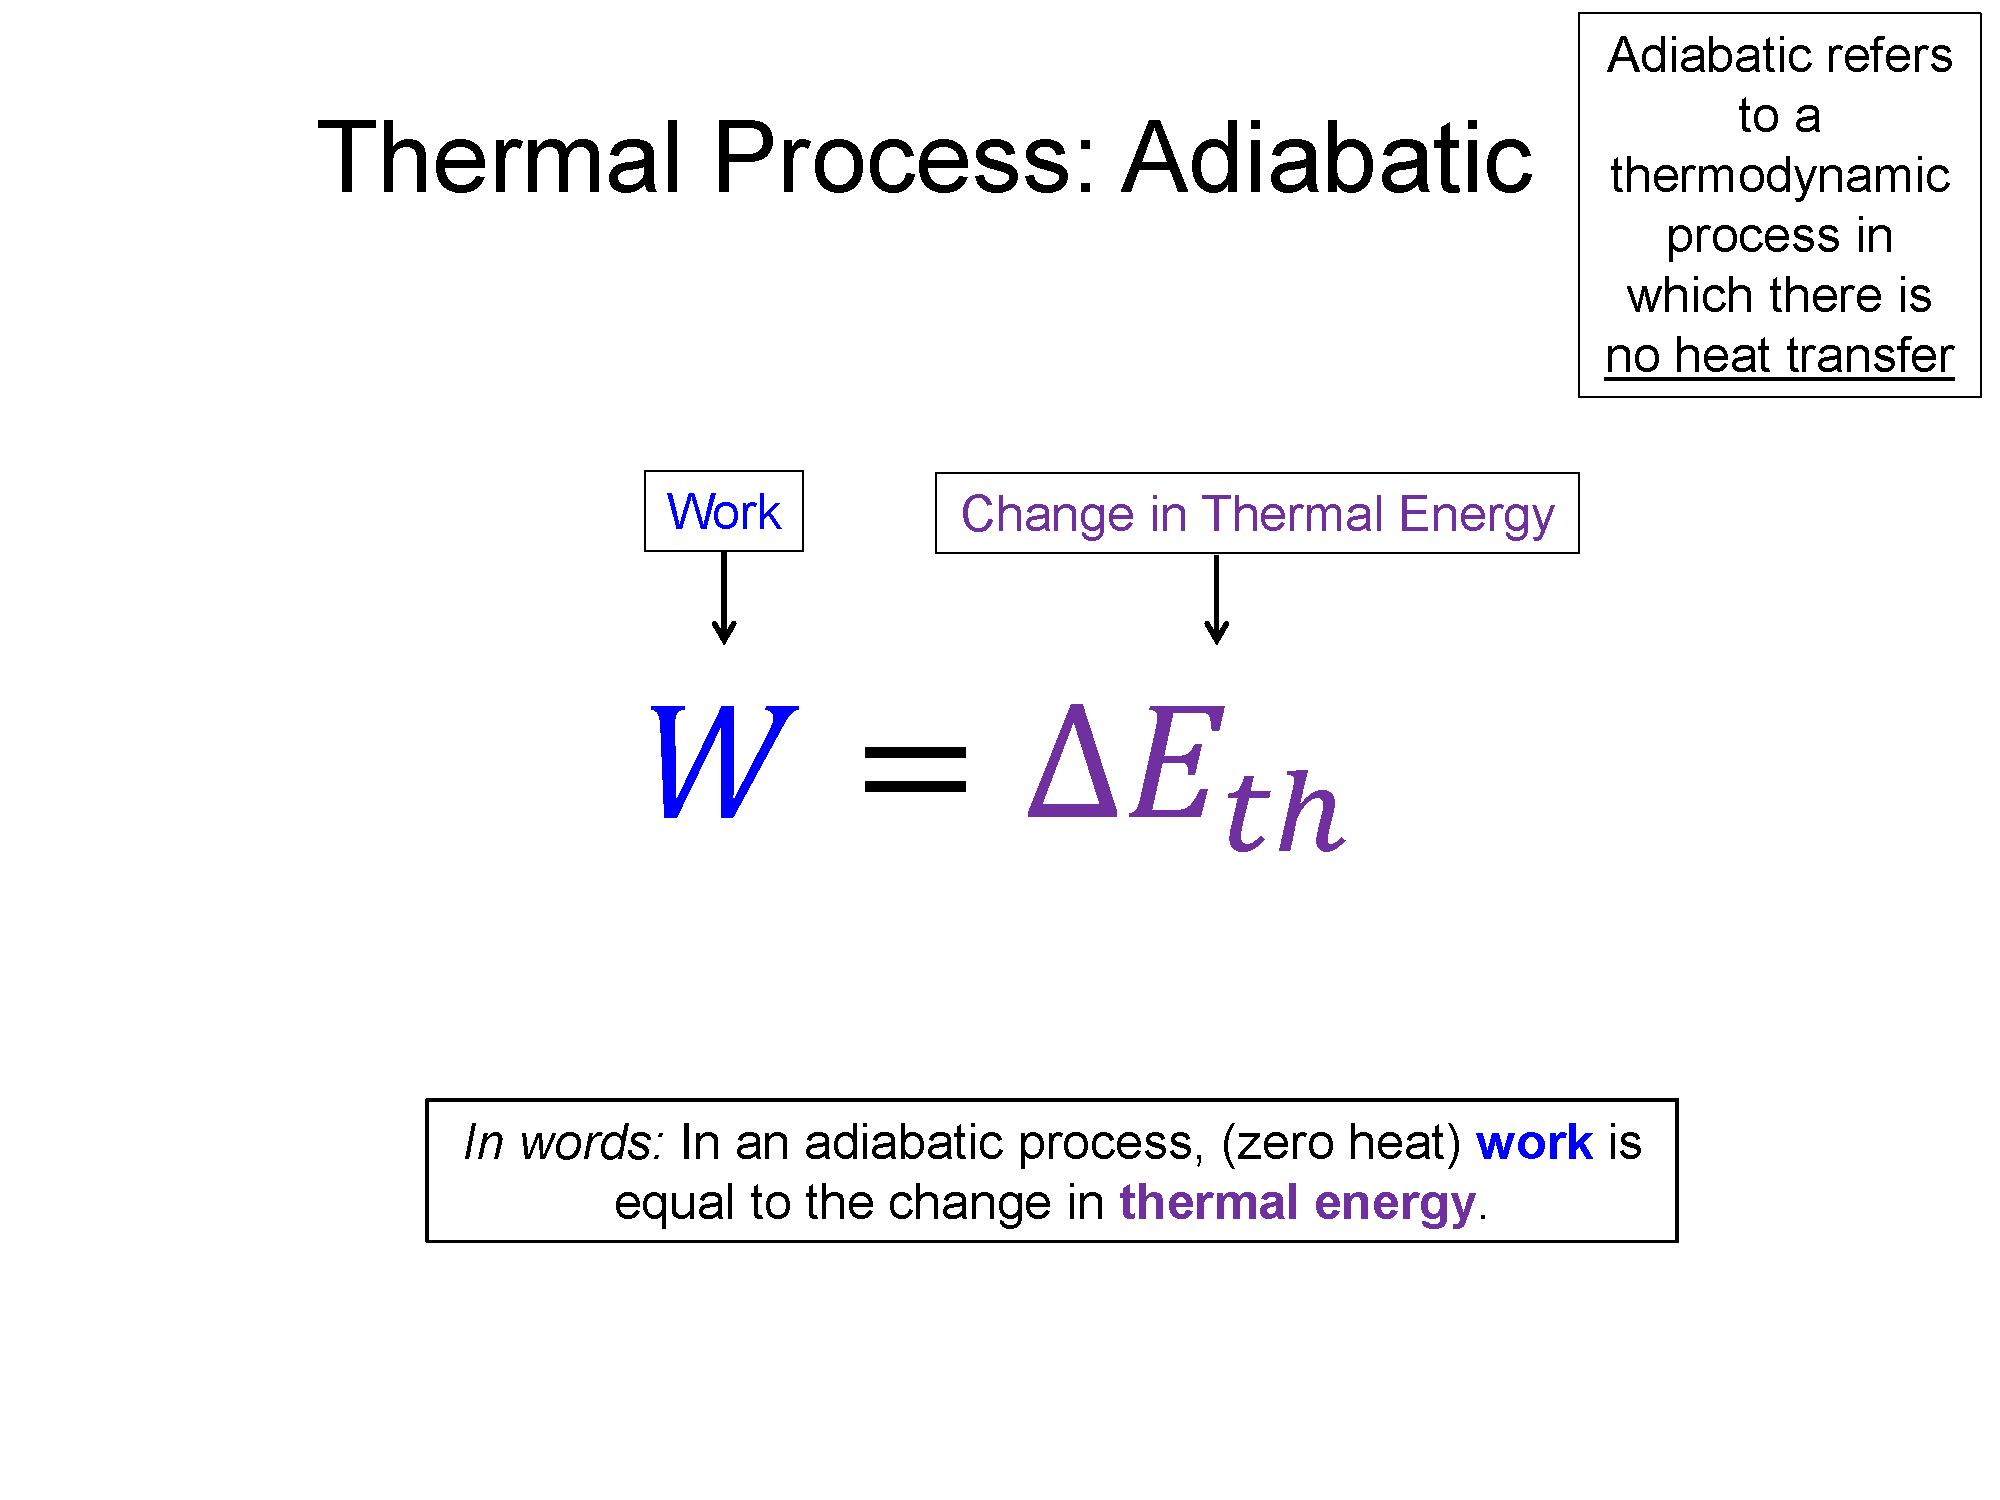
4) Heat in an adiabatic process is always 0.
When drawing a PV diagram, an Isothermal curve must ALWAYS curve AWAY from the P and V axes (or get closer to them as P or V increases if you prefer to think of it that way). It is a frequent mistake since isothermal curve are parabola-like and bow towards or away from the origin, but they must ALWAYS bow towards the origin (open away from it).
The 1st law is always true, both for the total cycle and each step along the way, use it everywhere to save a lot of time and energy once you know 2 out of 3 of work, heat, or change in thermal energy in any section of the cycle.
The area underneath the curve in a PV diagram is work! Use geometry to find it unless the curve is isothermal, then use the equation for it!
There are two ways to tell a heat engine from a heat pump/refrigerator 1) If it is a cycle (returns to the place it starts on a PV diagram) if it progresses clockwise then it is a heat engine, counter-clockwise is a heat pump/refrigerator. 2) Heat engines do net work, heat pump/refrigerators take in net work. Therefore, you can tell by the sign of the work, negative is a heat engine, positive is a heat pump/refrigerator. Without calculating anything, you can tell this by finding the sign of work for the process on the top of the diagram (has most area underneath it, so it determines the sign of work). For expanding processes where V increases, work is negative. For contracting processes where V decreases, work is positive.
Checklist
Begin filling in the table with "non-calculation" values - values you can read right off the plot.
Use proportional reasoning to find the Tempearture at the points in the cycle.
If actual numbers are given in the problem, calculate the numerical value of P, V, and T at the points on the cycle.
Make a First Law table.
Fill in zeroes during steps where there is no work - whenever $V$ is constant.
Calculate $\Delta E$ for each step by using the equipartition theorem $\Delta E = D\frac{1}{2}Nk_b \Delta T$ where D is the degrees of freedom for your substance - $D=3$ for a monatomic gas.
Use the First Law $\Delta E = Q + W$ to solve for the heat.
Recall that $ PV = nRT = Nk_B T$, so if you have the equipartition theorem that says $\frac{3}{2} Nk_B \Delta T = \Delta E$, you can relate that to $PV$, which makes adding up totals easier. Do not report Q totals as ex $3NRT - PV$, convert to the same state variables.
Fill in remaining spots on table and sum up totals.
*GOOD way to check your work: Make sure that total $\Delta E=0$.
Misconceptions & Mistakes
-
Not making a table
-
Forgetting which equations you have at your disposal: first law, second law, equipartition theorem, and ideal gas law. (I think this is an exhaustive list..? I'll watch lecture vids tomorrow and see if more come up)
Pro Tips
-
Make a table! You will be so lost without one. A table helps you identify which information you have and what you lack. It will also make the relationships between different steps more obvious - recall when doing energy analysis, we could often fill in "potential energy = 0" to multiple entries. The same thing happens with PV Diagram tables. This helps you determine which variables you have are actually unkown, which helps you find the correct equations to apply.
-
PV Diagrams are tedious, don't expect them to be anything else when digging into one. You will not have a linear path to solving the problem (you probably can't just go left-to-right and top-to-bottom filling out your table) and will probably have to jump between different points in the cycle. This is okay, this is how they're supposed to be done.
-
Lots of systems change their thermal energy by units of $\frac{3}{2}Nk_{B}T$, and the thermal energy of a system is often $\frac{3}{2}Nk_{B}T$. For lots of book problems/mastering physics problems/homework problems, the entry in one of the boxes is just $\frac{3}{2}Nk_{B}T$, where T is the temperature at the point (probably labeled with a subscript so $T_A$, $T_B$, or something like that). Get used to seeing and writing $\frac{3}{2}Nk_{B}T$.
-
The only equations you need are the ideal gas law, the first law, the second law, and the equipartition theorem. A few of these combine to make the virial equation, which is also sometimes useful.
-
$Nk = nR = pV$. That means $3/2 nKT = 3/2 pV$. This is sometimes useful <needs formatting>
Multiple Representations
Multiple Representations is the concept that a physical phenomena can be expressed in different ways.
Physical
The diagrams below describe the heat engine process.The heat engine, or system takes in energy from a hot source where the heat energy is extracted to do work and waste leaves the system as used energy to the cold resevoir.
Mathematical
$\Delta E = Q+W$
$PV=NK_{b}T$
Efficiency: $ e = \frac{|\sum W|}{\sum Q_{in}}$
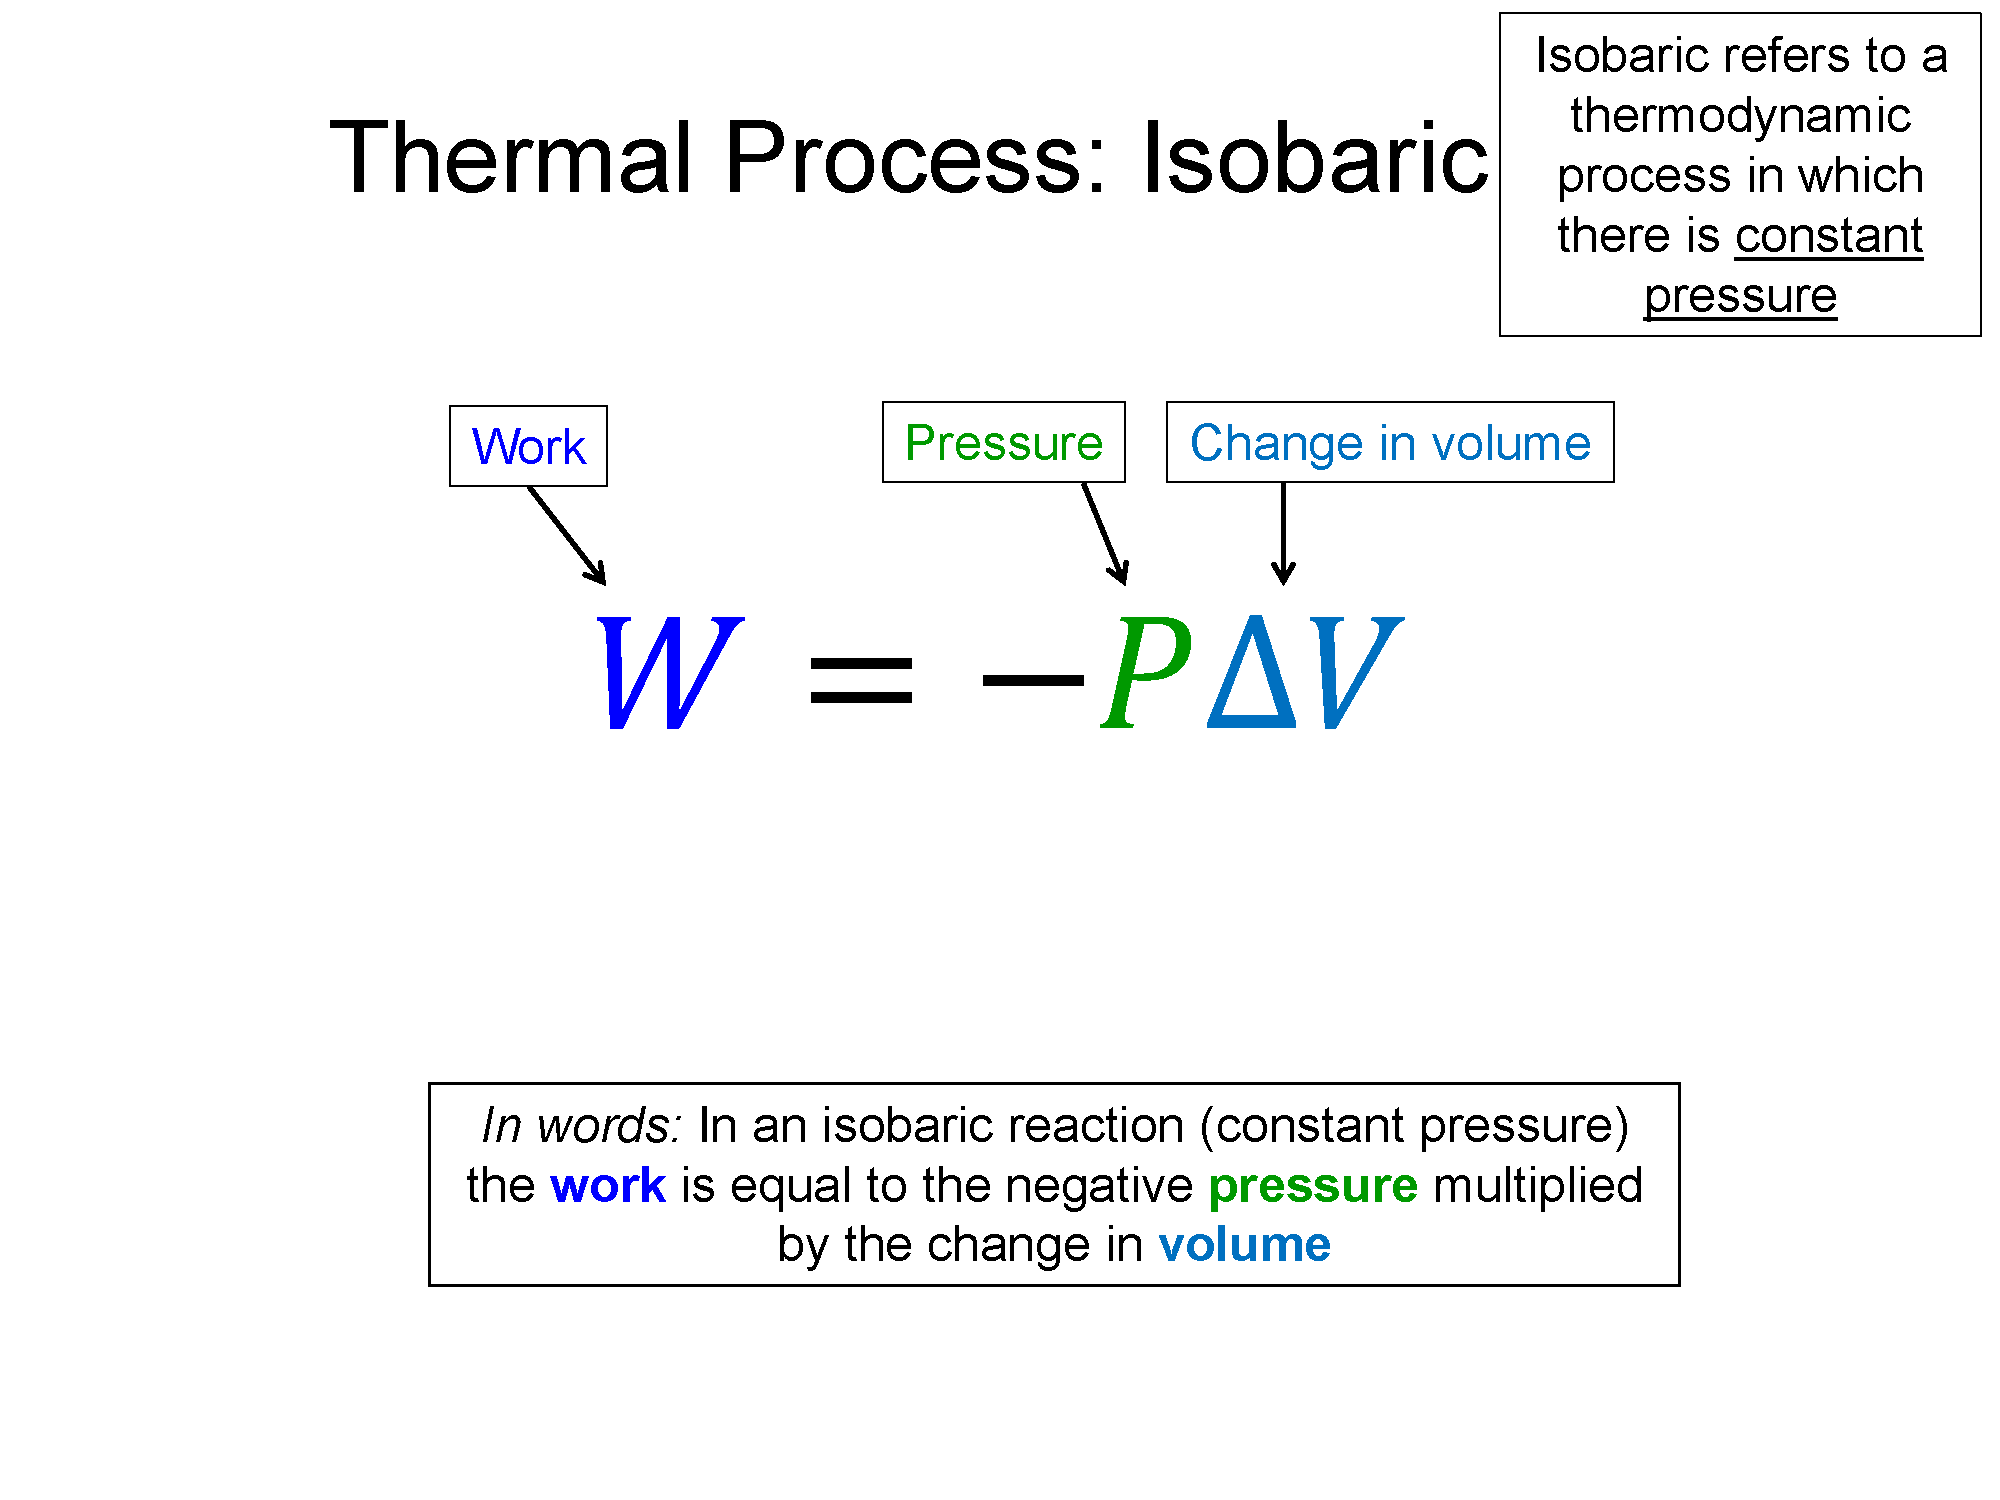
Isobaric
$\Delta P = 0$, then $\Delta V \propto \Delta t$
$W = P \Delta V$
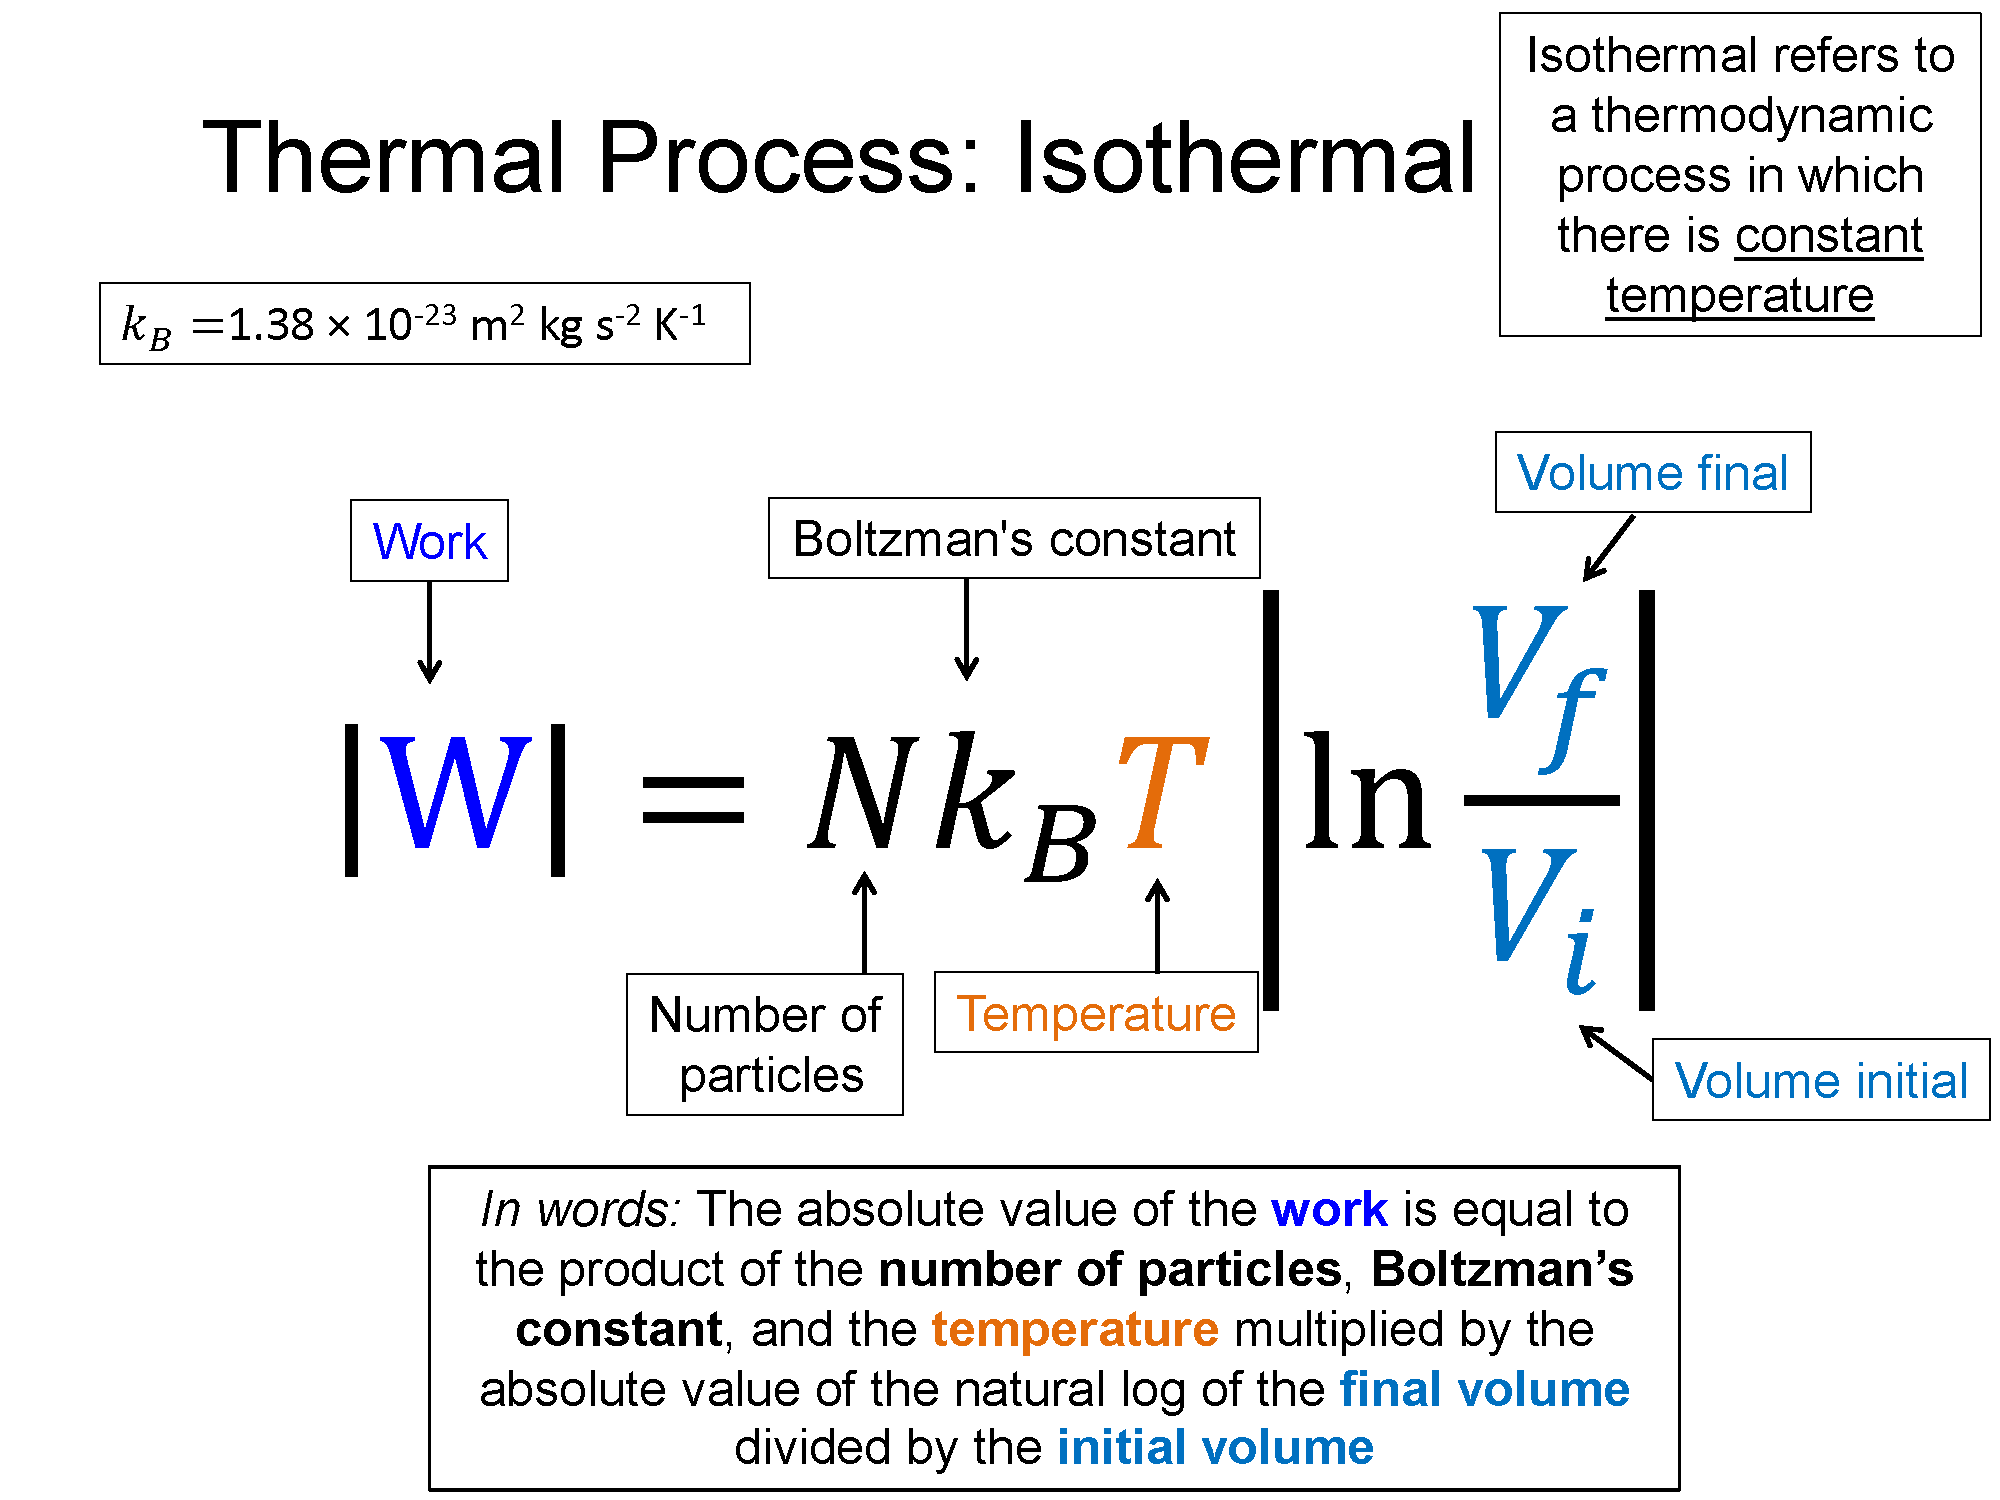
Isothermal
$\Delta T = 0$, then $P \propto \frac{1}{V}$
$W = \frac{3}{2}nT ln(\frac{V_{f}}{V_{i}}))$
Adiabatic
$Q=0$, then $\Delta E = W$
Isochoric
$\Delta V = 0$ and $W=0$
Totale energy ($E$), Heat ($Q$), Work ($W$), Efficiency ($e$), Pressure ($P$), Volume ($V$), Time ($t$), Temperature ($T$),
Number of moles ($n$)
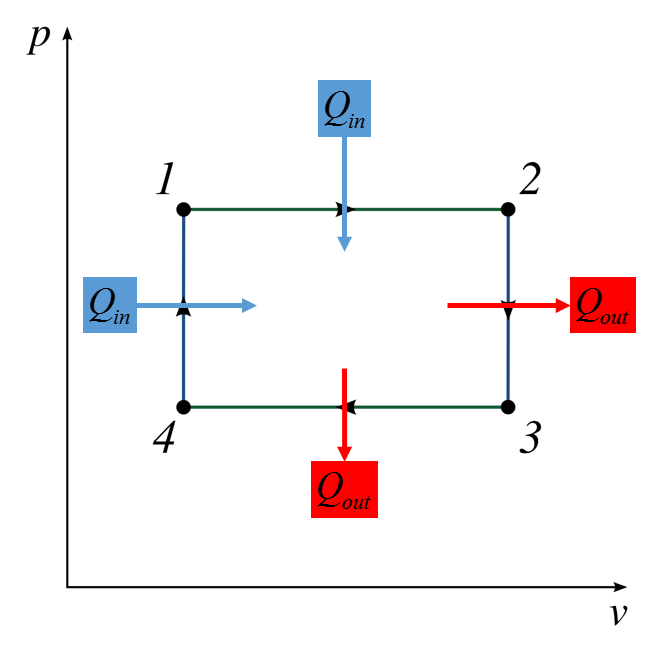
Graphical
1-2 Isobaric, 2-3 Isothermal
Descriptive
Here is a link to a description of the Carnot Cycle from Hyper Physics. This is an ideal description of a perfectly efficient cycle.
![]()
Experimental
The Experimental Representation for this would be to build a Stirling engine which is an application of the Carnot cycle.
Practice
Use the practice problem sets below to strengthen your knowledge of this topic.
Fundamental examples
Short foundation building questions, often used as clicker questions, can be found in the clicker questions repository for this subject.
![]()
Practice Problems
BoxSand's quantitative problems
Recommended example practice problems
- There are three sections from the openstax textbook which all have large sets of practice problems related to thermodynamic cycles. The practice exercises are located at the bottom of the pages.
- 15.3 Second Law and Heat Engines, Website Link
- 15.4 The Carnot Heat Engine Website Link
- 15.5 Heat Pumps and Refridgerators Website Link
For additional practice problems and worked examples, visit the link below. If you've found example problems that you've used please help us out and submit them to the student contributed content section.