When a ambulance drives past you at a high speed you can hear a change in the pitch of the sound. That change in the preserved frequency is called the Doppler effect. Whenever there is relative motion between a wave source and an observer, a Doppler shift in the frequency occurs.
The Doppler Effect is a straight forward concept to understand, let Alt Shift X explain and outline the basic idea.
https://www.youtube.com/watch?v=h4OnBYrbCjY
Pre-lecture Study Resources
Watch the pre-lecture videos and read through the OpenStax text before doing the pre-lecture homework or attending class.
BoxSand Videos
Required Videos
Warning: there is rumor of a sign error somewhere in these videos. If you spot this elusive error, please contact KC - it's his fault.
Suggested Supplemental Videos
Learning Objectives
Summary
Summary
Atomistic Goals
Students will be able to...
BoxSand Introduction
Traveling Waves | Doppler Effect
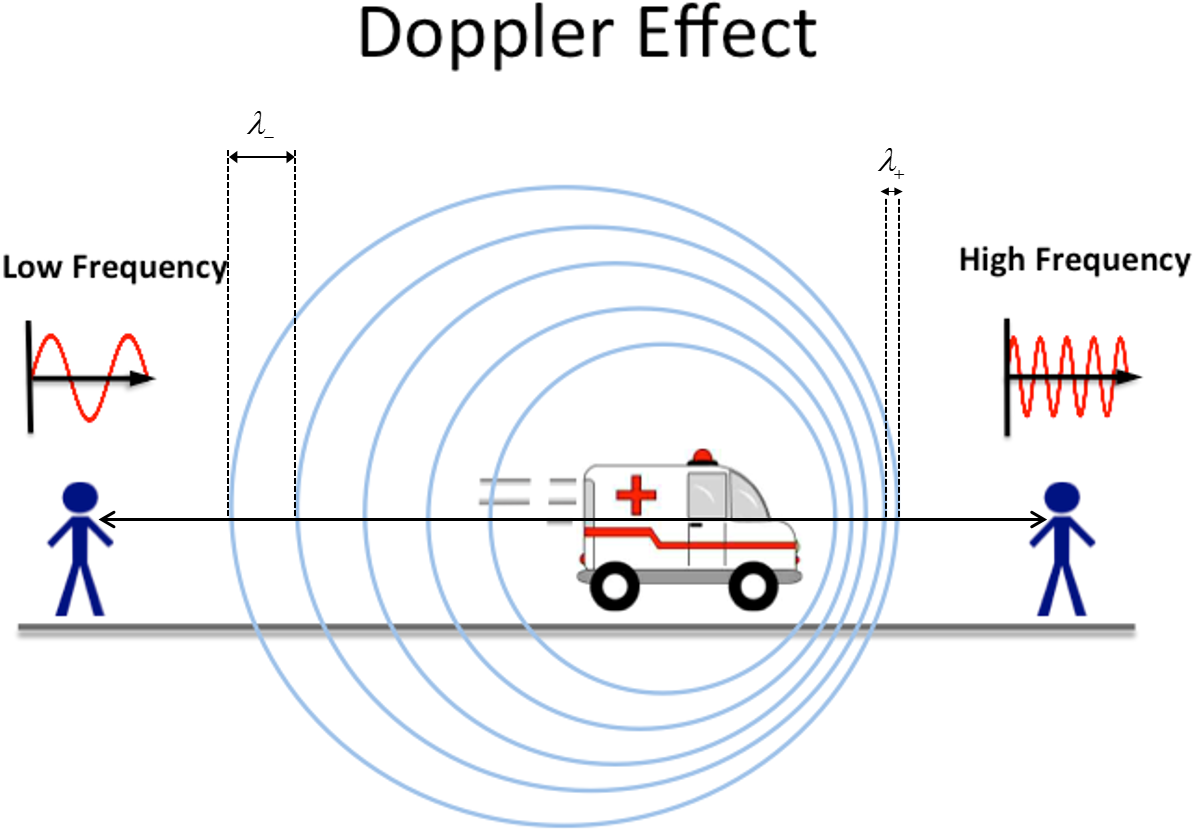
Whenever a wave source and an observer of that wave are moving relative to each other, the observed frequency will be shifted from the original frequency. To visualize this effect you have to think about the wave fronts for a source that is moving.
In the above animation, imagine that is a wave from a police siren and the car is going to drive past you. In front of the car (before it's passed by) the wavecreast are crunched together. If you are to hold a pencil to the screen and verbally make a tick sound each time a wave crest passes by, you'll get a feel for the frequency observed in front of the police car. Do the same thing to a point behind the car and sound out the ticks as each wave creats passes by. It should be very obvious the rate, and thus frequency, is higher in front than behind. In the case of a siren as a car passes by, you hear the frequency go from a high pitch (higher than in the frame of the car) to lower pitch (lower than in the frame of the car).
- If the distance between the source and the observer is decreasing, than the observed frequency is shifted up (and wavelength is smaller).
- If the distance between the source and the observer is increasing, than the observed frequency is shifted down (and wavelength is larger).
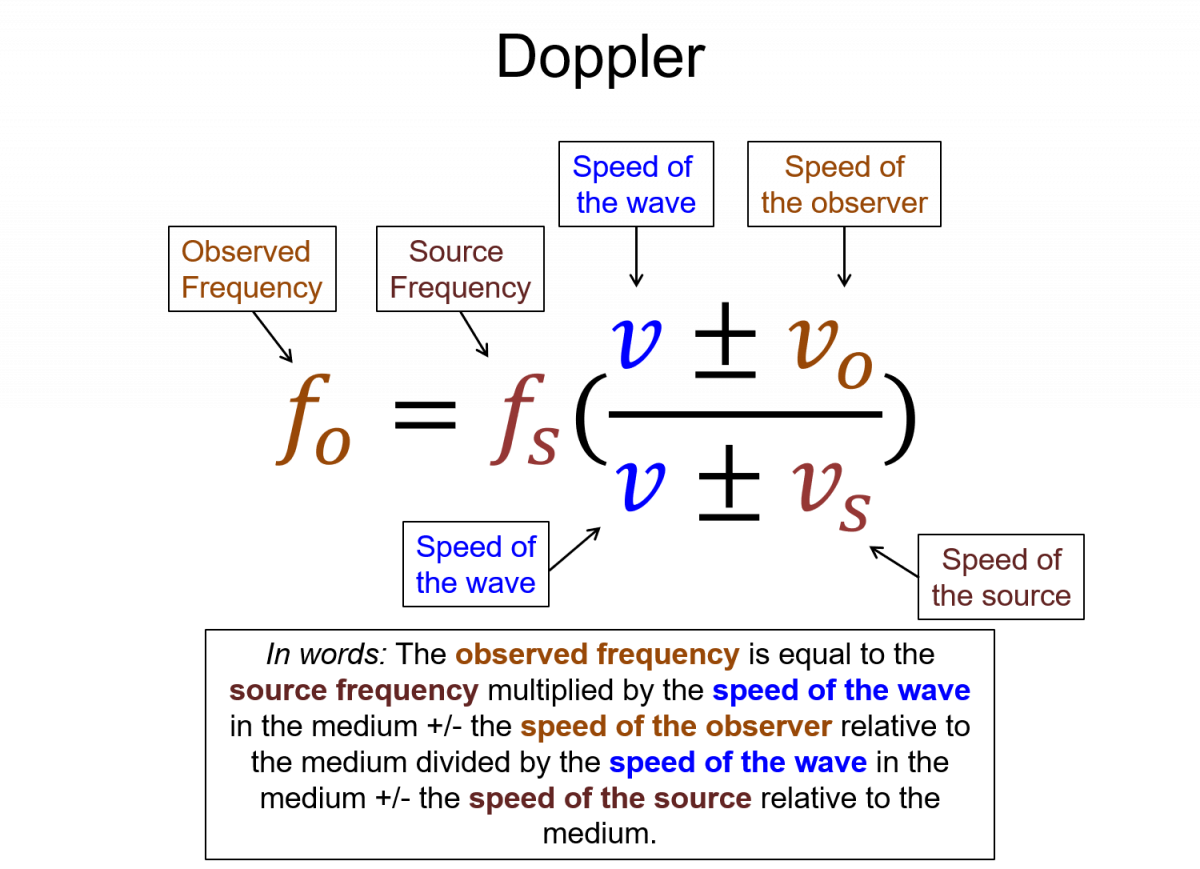
The equation (in 1D) introduced here will handle cases of either a moving source or observer, or even both moving. It involves both the observed frequency $f_o$, the source frequency, $f_s$, and the speed of the wave relative to the medium v.
$f_o$ = $f_s$ $\left( \frac{ v \pm v_o }{ v \mp v_s } \right)$
$v_o$ = speed of observer relative to medium, choose (-) in the numerator if the observer is moving away from the source, (+) if the observer is moving towards the source
$v_s$ = speed of source relative to medium, choose (+) in the denominator if the source is moving away from the observer, (-) if the source is moving towards the observer
Sensemaking Protip: Use your conceptual understanding to determine if the frequency observed is greater than or less than the frequency of the source. Then make sure you pick the correct signs in the equation's numerator and denominator such that the fraction is less than or greater than 1.
Key Equations and Infographics
Now, take a look at the pre-lecture reading and videos below.
OpenStax Reading
OpenStax Section 17.4 | Doppler Effect and Sonic Booms
![]()
Additional Study Resources
Use the supplemental resources below to support your post-lecture study.
YouTube Videos
Doc Schuster talks about the Doppler Effect. Note there is a part two to this video but it covers material not discussed in this section.
https://www.youtube.com/watch?v=1Ps8BYnDG0A
Conceptual understanding - this is a good video to watch if you're more of a visual learner. It discusses how waves "bunch up" or "stretch out" due to the Doppler Effect.
https://www.youtube.com/watch?v=h4OnBYrbCjY
Other Resources
This link will take you to the repository of other content related resources .
![]()
Simulations
Space Ship Simulation: this simulation allows visualization of the Doppler Effect. Note that the sinusoidal graph in the bottom left shows how the wave changes due to the doppler effect.
![]()
For additional simulations on this subject, visit the simulations repository.
![]()
Demos
For additional demos involving this subject, visit the demo repository
![]()
History
Oh no, we haven't been able to write up a history overview for this topic. If you'd like to contribute, contact the director of BoxSand, KC Walsh (walshke@oregonstate.edu).
Physics Fun
Other Resources
University of Conneticut Physics section for the Doppler Shift,
![]()
Daniel Russell from Pennsylvania State University has a nice site with animated gifs and an explaination of the sonic boom effect,
![]()
This pdf goes itno some depth about the Doppler Effect,
![]()
This link takes you to a short introduction to the Doppler Effect.
![]()
Hyperphysics has three sections related to the doppler shift
| Sound | Police Radar Application | Light |
Other Resources
This link will take you to the repository of other content related resources .
![]()
Resource Repository
This link will take you to the repository of other content related resources.
![]()
Problem Solving Guide
Use the Tips and Tricks below to support your post-lecture study.
Assumptions
The doppler effect revolves around a consistent speed of a wave, in most cases sound, and the funny effects that happen when the source or the person observing the sound is moving at speed approaching the speed of the wave.
Let's tackle the extreme cases! If our source is moving at the same speed as the wave does after it produces it, then the peaks of the wave don't travel far, or anywhere after they are emitted, and the peaks just keep getting produced one on top of the other. We know that when wave peaks overlap, they add, so we get a much higher burst of sound. This effect is what is called a sonic boom, and is something that happens with objects moving near the speed of sound (like a fighter jet, which can actually go faster than the speed of sound too!). In addition, if those peaks are separated by only a small distance, the number of cycles a stationary observer would experience each second from the wave would go up really high, the number of cycles per second is what we call the frequency, so the frequency increases as the source moves quickly towards us. You've probably seen this effect from ambulances and other emergency vehicles with sirens, the frequency increases as they get near you and then decrease as they move away. The 2nd effect is what happens when the source recedes from the observer, the peaks of the wave get more spaces out and so the observe experiences fewer cycles of the wave per second, so the perceived frequency decreases. Interestingly, since the frequency of an ambulance increases as it approaches you, and decreases as it moves away from you, you may not have ever heard the real frequency of an ambulance unless you've seen one playing its siren while remaining still relative to you, as when that happens, all these effects go away! That means you could both be at rest or you could be travelling at the same speed in the same direction as the ambulance to hear its true frequency (but also pull over if an ambulance is coming up behind you with its siren on!).
Checklist
- Any question regarding Doppler shifts revolves around the equation $$f_o = f_s \left(\frac{v \mp v_0}{v \pm v_s}\right) $$ here $v_o$ is the speed of the observer, $v_s$ is the speed of the source, $f_s$ is the frequency of the source, $v$ is the wavespeed through the medium, and $f_o$ is the frequency as measured by the observer.
- The most crucial part of a Doppler shift problem is correctly identifying the sign of $\Delta \vec{r}$. First, draw a pictorial representation and determine a coordinate axis.
- $\hspace{1cm}$ If the absolute distance between the source and observer $| \Delta \vec{r} | $ is increasing, choose a minus sign for $v_o$ and a plus sign for $v_s$.
- $\hspace{1cm}$ If the absolute distance between the source and observer $| \Delta \vec{r} | $ is decreasing, choose a plus sign for $v_o$ and a minus sign for $v_s$.
- Remember that $v$ is the wavespeed of the medium. If we are discussing a sound wave traveling through the air, for example, the wavespeed is the speed of sound in air $v=343 \frac{m}{s}$. If we are considering an electromagnetic wave, such as when we calculate the redshift of a photon due to the expansion of the universe, we use the speed of light $c = 2.998*10^8 \frac{m}{s}$.
- Once you have identified the wavespeed and the signs of the variables in equation (1), the rest of the problem is typically straightforward: you are either asked about the frequency of the source given what is observed, or vice-versa. For these problems all you need to do is plug and chug, maybe with a little algebra first. In any case, most problems give you all of the information except for maybe one or two of the variables in the Doppler shift equation.
- If more than one variable in the Doppler shift equation is unknown, you need more than one equation to solve for them, so remember that you have the equation $v = \lambda * f$ at your disposal. If you still find you don't have enough equations, read the problem statement again very carefully to see if you missed something.
Misconceptions & Mistakes
- Either the source or observer must be moving in order for doppler shift to occur. Specifically, they must be moving relative to each other. This means that if both the source and observer are moving in the same direction with the same velocity, there will be no doppler shift.
- Mistaking shift as a change in loudness (amplitude), when it is a change in pitch (frequency).
- Mistaking the signs in the formula to mean axial directions rather than increasing/decreasing distance.
- Solving doppler shift problems sometimes involves algebreically manipulating a number of fractions, and sometimes a value ends up in the numerator when it should be in the denominator or vice versa. To avoid this, you should verify that the dimensions of your final equation are correct: ex. if you're solving for a frequency, the dimensions should come out to $\frac{1}{2}$.
Pro Tips
- Draw a picture! Because Doppler shift problems all rely on the same equation, the most common way to make them more challenging is to have a situation that is hard to picture in your mind - such as someone swinging an alarm over their head and asking about frequency shifts along certain portions of the alarm's motion.
- Remember that for an object undergoing uniform circular motion, you can determine its velocity if you know its period and the radius of the circle it travels through - where $v = \frac{2 \pi r}{T}$.
- The Doppler equation can look overhwelming, but that's partly just a presentation issue. The Doppler equation we list here is the most general form. Other sources will list many forms of the Doppler equation, each form corresponding to a different physical scenario - e.g. observer is not moving + distance is decreasing or observer is moving + distance is decreasing, etc. To some, this can look overwhelming - why are there so many Doppler equations?! - but remember that this is just solving that main equation for specific cases. If you're more comfortable picking from a list or table of equations, have that handy (a list can be found at the back of the chapter in most textbooks); we recommend using the general form of the equation just to avoid accidentally picking the wrong equation, but everyone has a different preference, so do what is most comfortable for you.
Multiple Representations
Multiple Representations is the concept that a physical phenomena can be expressed in different ways.
Physical
Mathematical
$f_{0} = f_{s}\left(\frac{V \pm V_{0}}{V \mp V_{s}} \right)$
Observe frequency ($f_{0}$), Source frequency ($f_{s}$), Speed of wave medium ($V$),
Speed of observer relative to source ($V_{o}$), Speed of source relative to observer ($V_{s}$)
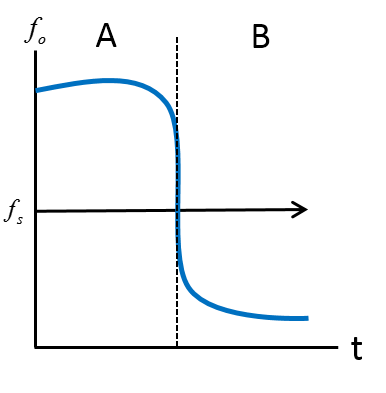
Graphical
The graph depicts aa situation where the distance between the emitting source and the observer is decreasing in region A. For region B, the distance between the emitting source and the observer is increasing.
Descriptive
The Doppler shift is when the observed frequency is shifted from the original frequency produced by the soure when the observer and source move relative to eachother.
Experimental
A well known example experiement could be to listen to the frequency of emergency vehicles sirens when they approach and drive past you. The following video is very poor quality, but it clearly demonstrates the doppler shift.
Practice
Use the practice problem sets below to strengthen your knowledge of this topic.
Fundamental examples
1. Below is a graph of frequency vs time. The dotted line represents the frequency of a horn from a car at rest. Roughly sketch a graph of the frequency you hear when a car is approaching you at a constant speed from $t_0$ to $t_1$. At $t_1$ the car passes you and is now receding from you at an increasing speed.

2. A bat emitting a sound with frequency of $50 \, kHz$ is traveling $11 \, m/s$ as seen in the figure below. Person “a” is running away from the bat also at a speed of $11 \, m/s$. Person “c” is running towards the bat at a speed of $20 m/s$. What frequencies are heard by each person? Assume the bat is an ideal source of sound.
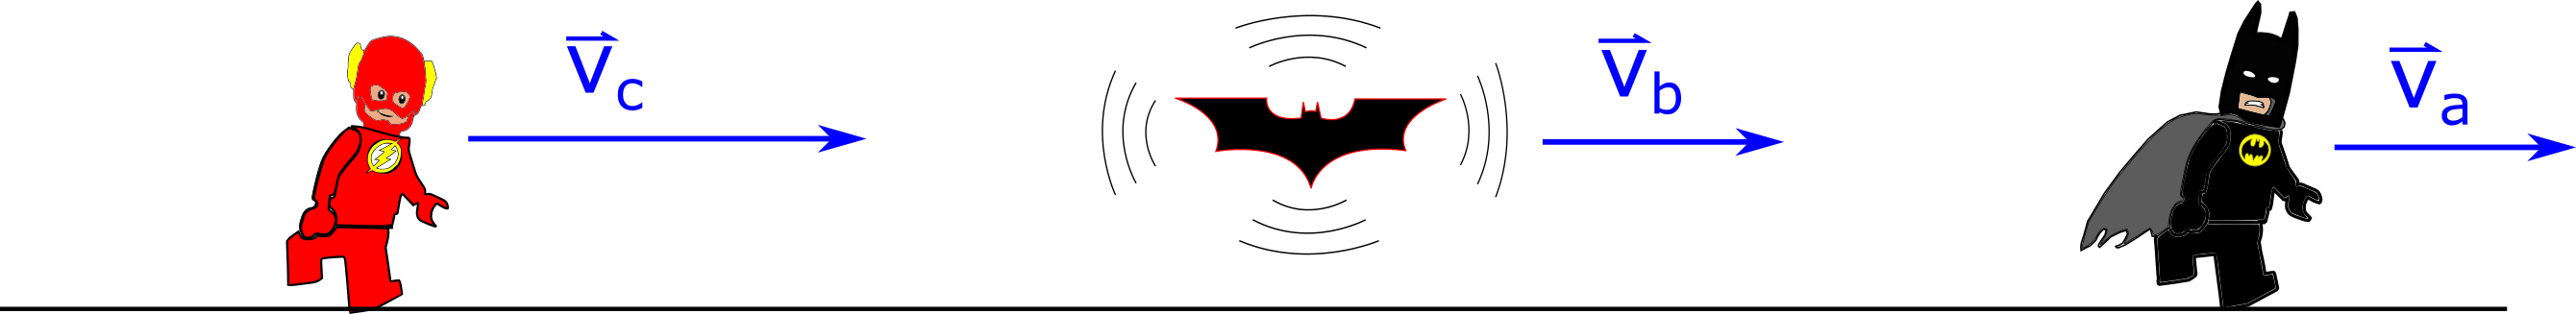
Click HERE for solutions.
Short foundation building questions, often used as clicker questions, can be found in the clicker questions repository for this subject.
![]()
Practice Problems
Conceptual problems
BoxSand's multiple select problems
BoxSand's quantitative problems
Recommended example practice problems
- Openstax section on doppler effect has several good practice problems, Website Link
- Set of problems w/ discussed solutions, all text, Website Link.
- Worksheet of problems w/ soln, Offsite PD
For additional practice problems and worked examples, visit the link below. If you've found example problems that you've used please help us out and submit them to the student contributed content section.