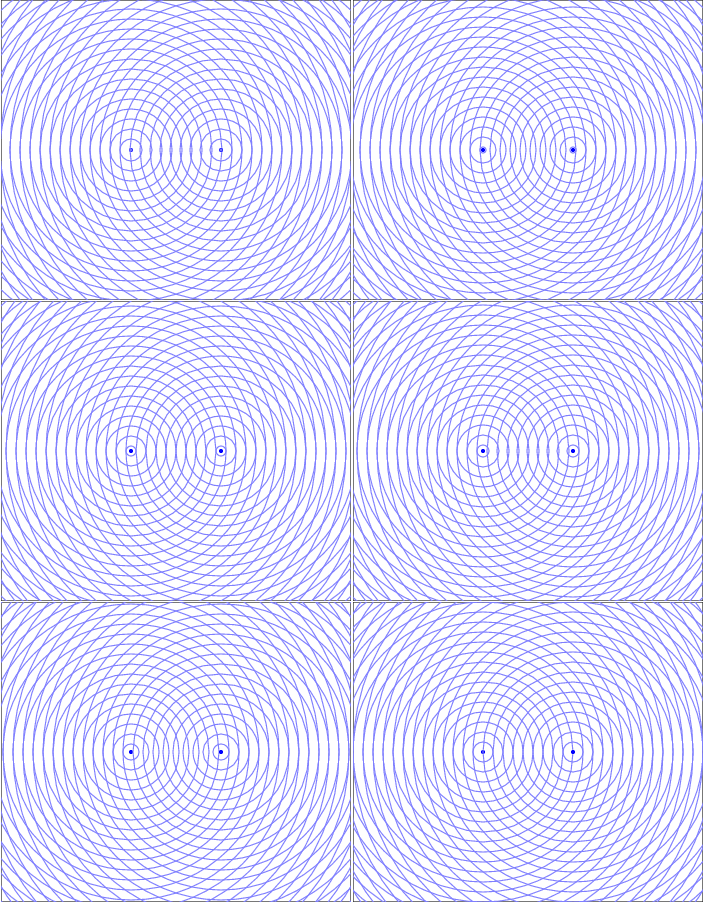
When two waves enter the same space at the same time they can interfere in a such a way to cause a larger effect called constructive interference. They can also interfere in such a way to create a smaller effect called destructive interference. Light behaves like a wave and displays these light and dark inference patterns when setup in a clever way.
Interference is all about the Path Length Difference!
Pre-lecture Study Resources
Watch the pre-lecture videos and read through the OpenStax text before doing the pre-lecture homework or attending class.
BoxSand Introduction
Superposition of Waves | General Two Source Interference
When two waves enter the same region of space at the same time they interfere in a way that obeys the Superposition of Waves. This addition of waves creates places where the peaks line up and the resultant wave is larger, which would manifest as a bright spot for light waves. There are also regions where the peak from one wave is lined up with the trough from the other and the resultant is wave cancelation, where their amplitudes add to zero and there would be a dark spot. These constructive and destructive areas are seperated by an entire gradient of partially constructive and partially destructive. The resulting interference pattern is one of the defining features of a wave.

Key Equations and Infographics


Now, take a look at the pre-lecture reading and videos below.
BoxSand Videos
Required Videos
Superposition - Two Source Interference (12min)
Superposition - Two Source Interference - Extending to 2-D (2min)
Suggested Supplemental Videos
OpenStax Reading
Fundamental examples
(1) A red laser with wavelength $\lambda = 700$ nm shined on a double-slit with width $d=10$ mm. The screen is located $D= 2 $ m away from the slit. How far up from the central maximum is the $m=2$ bright fringe?
(2) How does the position of the 2nd bright fringe in example 1 change if the wavelength used is $\lambda_{new} = 350$ nm instead of $\lambda_{old} = 700 $ nm?
(3) In a single-slit experiment, the width of the central maximum is $1.5 $ mm. The screen is 1 meter from the slit and the wavelength of light used in this experiment is $360 $ nm. (a) What is the size of the slit? (b) How much wider would the central maximum be if the wavelength was tripled?
(4) In a single-slit experiment, the second dark fringe is located 7.5 cm from the center of the central maximum on a screen located $L = 3 m$ away from the slit. What is the distance between the second dark fringe and the third dark fringe that is located on the other side of the central maximum? The wavelength of the illuminating light is $\lambda = 600 $ nm.
Solutions found HERE
Short foundation building questions, often used as clicker questions, can be found in the clicker questions repository for this subject.
Post-Lecture Study Resources
Use the supplemental resources below to support your post-lecture study.
Practice Problems
Conceptual Problems
BoxSand's multiple select problems
BoxSand's quantitative problems
Recommended example practice problems
- PhysLabs
- Double Slit Worksheet: Website Link
- Single Slit Worksheet: Website Link
- OpenStax Practice problems at the end of sections
- Young's Double Slit: Website Link
- Multiple Slit Diffraction: Website Link
- Single Slit Diffraction: Website Link
For additional practice problems and worked examples, visit the link below. If you've found example problems that you've used please help us out and submit them to the student contributed content section.
Additional Boxsand Study Resources
Additional BoxSand Study Resources
Learning Objectives
Summary
Summary
Atomistic Goals
Students will be able to...
YouTube Videos
Simulations
Phet - wave interference,
For additional simulations on this subject, visit the simulations repository.
Demos
History
Oh no, we haven't been able to write up a history overview for this topic. If you'd like to contribute, contact the director of BoxSand, KC Walsh (walshke@oregonstate.edu).
Physics Fun
Lake Experiment #235 - Square Wave Interference(1min)
Other Resources
Problem Solving Guide
Use the Tips and Tricks below to support your post-lecture study.
Assumptions
Checklist
1. Read the problem carefully and visualize the physical setup.
2. Determine if it is indeed a problem best analyzed with wave optics and not ray optics.
3. Determine what physical model best fits the problem. Is it a double, multi, or single slit interference or is a thin film effect?
4. For the type of system, draw the appropriate physical representation.
5. Organize the relevant equations for the specific system.
6. Determine what variables are known or unknown. Perhaps what variables are changing - is it a proportional reasoning problem?
7. If it is a slit problem, is it in the small angle approximation? If so, how does this simplify the equations?
8. Solve the system of equations, perhaps with the use of geometry (this is a big step and mastery comes with practice).
9. Check your answer for reasonableness. Magnitude, dimensions, limiting cases?
Misconceptions & Mistakes
- ... students mistakenly assume all the interference patterns are the same
- ... students mistakenly make the small angle approximation for all cases
- ... students mistakenly ignore the $\pi$ phase shifts in certain reflections in a thin film interference
Pro Tips
- Draw the physical representation - being able to see the fringes and the geometry is very useful
Multiple Representations
Multiple Representations is the concept that a physical phenomena can be expressed in different ways.
Physical
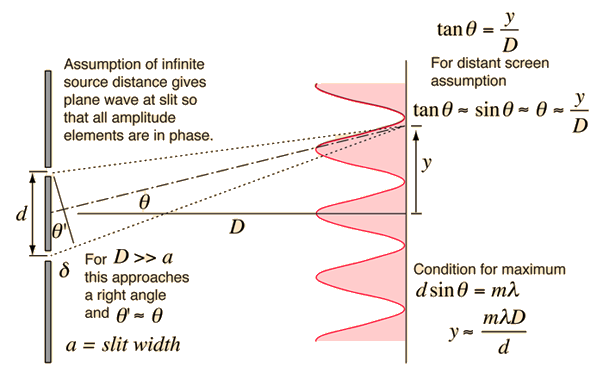
The diagram for Young's double slit experiment depicts the important features used to describe the phenomena.

From a single slit diffraction to mutli slit diffraction the single slit forms an envelope where the sharpness of bright peaks become more sharp as the number of slits is increased.

Mathematical


Graphical
Descriptive
Experimental