Waves carry energy and as the wave travels outward, that energy is spread out over a larger space. How loud a sound is depends not only on the energy put in by the source but also the distance between the source and the observer and the medium through which the sound travels.
XMphysics answers the question, what is wave intensity?
Pre-lecture Study Resources
Watch the pre-lecture videos and read through the OpenStax text before doing the pre-lecture homework or attending class.
BoxSand Introduction
Traveling Waves | Sound Intensity and the Decibel Scale
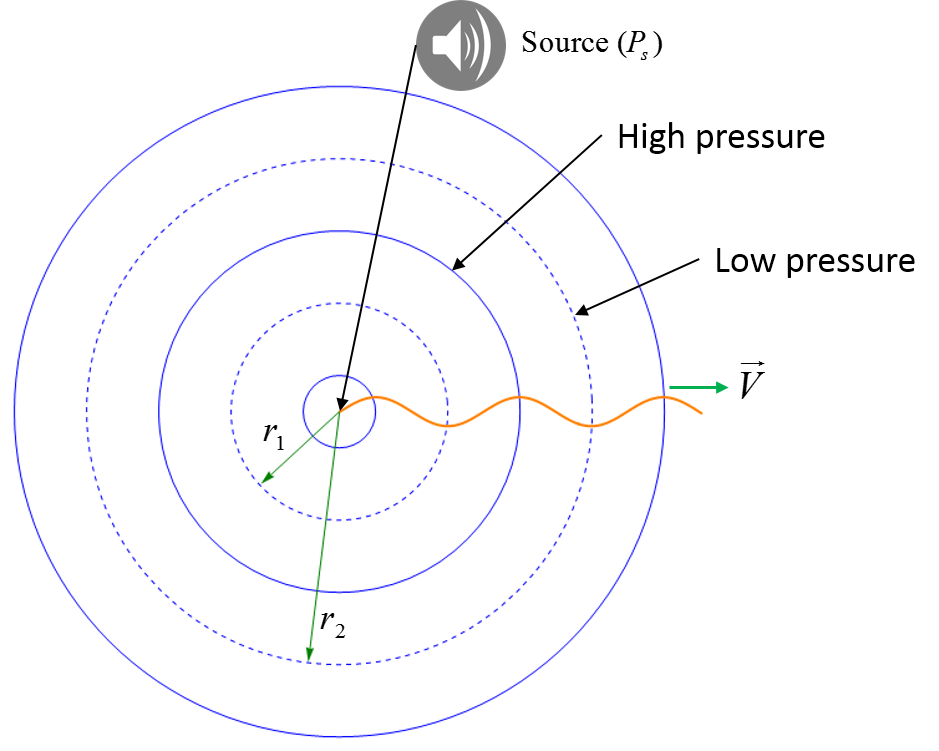
Waves require energy to be created and they carry that energy as they travel outward. Along the way that energy can become dissapated, usually because the space it occupies increases. Friction from the medium can add additional effects that absorb the wave's energy, decreasing the energy density at a given spot - for now, lets disregard those effects. For a spherical wave, like most sound and light waves, this effect can be visualized by the wave spreading from the source to fill the room.

Here the intensity, which is the power (Watts) per unit area, decreases as you move away from the source.
$P=\frac{energy}{time}$
$I = \frac{P}{A}$, where $A$ is the area over which the energy is spread
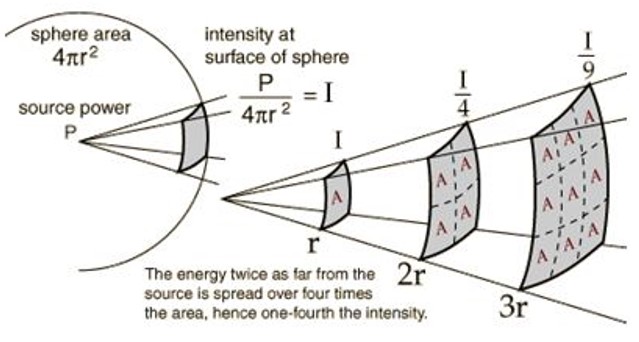
For a spherical wave, the energy is spread over the surface of a sphere. $A_{sphere}=4 \pi r^2$. So the intensity decreases inversely on the square of the distance from the source. This is an important physical observation, the so called inverse square law, also found in the universal law of gravity and in the interaction of charged particles.
Its common to consider the source producing some power (usually constant) that generates a wave, which decreases in intensity as it moves away from the source. That intensity then could be used to find the amount of energy per time (power) that is incident on a given region of space. This second power is not that of the source and the area may not be that of a sphere. For example if you have speaker powered by a 10 W source, that power spreads out over an area of $4 \pi r^2$ but then only some of that energy goes through a square window, where $A=l^2$, where $l$ is the length of the side of the window.
Decibel Scale: Sound Intensity Level
The range of human hearing, from the threshold of barely making out a sound, to that of causing damage, spreads 12 orders of magnitude. To deal with these large scales the Decibel scale was introduced. The Decibel Level ($\beta$), measured in dB's, is proportional to the log of the ratio of the intesity to that of the threshhold of human hearing, $I_0=10^{-12}\frac{W}{m^2}$.
$\beta=(10dB) log{\frac{I}{I_0}}$
Since the intesity $I$ depends on the power of the source, and distance between the source and the observer, the Decibel level also depends on those quantities.
Key Equations and Infographics


Now, take a look at the pre-lecture reading and videos below.
BoxSand Videos
Required Videos
Suggested Supplemental Videos
OpenStax Reading
Fundamental examples
1. A light string with a liner mass density $\mu_1 = 1.57 \times 10^{-3} \frac{kg}{m}$ is tied to a heavier string with a liner mass density $\mu_2 = 9.02 \times 10^{-3} \frac{kg}{m}$. A wave is sent down the light string at $60 \, Hz$ and it is noted that the tension in the light string is $10 \, N$. What are the wavelengths in each string?
2. Assuming an ideal spherical speaker operating at $100 W$ …
(a)…what is the intensity at a distance of $2.0 m$ to the right of the speaker?
(b)If another identical speaker is added to the same location as the first, what is the new sound intensity at the same location from part (a)?
(c)A third non-identical speaker is placed $1.0 m$ to the left of the original two speakers. The sound intensity level at the same location in part (a) and (b) is found to be $5.0 \, \frac{W}{m^2}$. What is the power output of the $3^{rd}$ speaker?
3. The sound intensity level in the driver’s seat of a car is found to be $ 88 \, dB$. What is the sound intensity at this location?
4. In the figure below, the power of source 1 is $10 \, W$, the power of source 2 is $20 \, W$, and the power of source 3 is $30 \, W$. What is the sound intensity level at the location labeled “a”?

Click HERE for solutions.
Short foundation building questions, often used as clicker questions, can be found in the clicker questions repository for this subject.
Post-Lecture Study Resources
Use the supplemental resources below to support your post-lecture study.
Practice Problems
Conceptual problems
BoxSand's multiple select problems
BoxSand's quantitative problems
Recommended example practice problems
- The Openstax section of Energy in Waves and intensity has a bunch of great problems, Website Link
- Practice problems w/ solutions, Offsite PDF Link
For additional practice problems and worked examples, visit the link below. If you've found example problems that you've used please help us out and submit them to the student contributed content section.
Additional Boxsand Study Resources
Additional BoxSand Study Resources
Learning Objectives
Summary
Summary
Atomistic Goals
Students will be able to...
YouTube Videos
Here Michel van Biezen discusses power per area in greater detail.
Khan Academy on the Decibel Scale.
Doc Schuster discusses sound waves and intensity,
Here is another video of Dr. van Biezen where he runs through an example problem on sound intensity at a distance.
Other Resources
This link will take you to the repository of other content related resources .
Simulations
This link takes you to the PhET simulation for sound intensity.
Download the file and make sure you have Java installed.
For additional simulations on this subject, visit the simulations repository.
Demos
History
Oh no, we haven't been able to write up a history overview for this topic. If you'd like to contribute, contact the director of BoxSand, KC Walsh (walshke@oregonstate.edu).
Physics Fun
Other Resources
Hyperphysics sections related to intensity,
Boston Univsity section on sound wave intesnity,
Other Resources
This link will take you to the repository of other content related resources .
Resource Repository
This link will take you to the repository of other content related resources.
Problem Solving Guide
Use the Tips and Tricks below to support your post-lecture study.
Assumptions
Decibels are a mathematically harder concept to wrap your head around because of the use of logarithm. However, we use them because they actually match the ways humans perceive sound and light intensity far better than the actual intensity values do. Generally, a human ear will perceive a sound to be "twice as loud" when it is actually 100 times as loud, same for light intensity with our eyes. Because of this, we invent these scales to use when we care about the subjective way humans perceive these quantities. Logs rescale functions to look at it in terms of exponential increase instead of linear increase. This means if you took a graph of $10^{2x}$ and took the log of it, it would become a straight line with a slope of 2. Normal logs (like in our equation) have a base of 10, so that means these logs applied to a function track how quickly a function changes by a factor of 10. If in our previous example of $10^{2x}$, everytime x increases by 1, the function increases by $10^2$ or 100, but for every increase of 100 when this function is inside the log, the logged value will increase by 2 (because the log is base 10, so it tracks increases by factors of 10, and 100 is 2 factors of ten ($10*10=10^2=100)).
Checklist
There isn't a comprehensive way of solving these types of problem, but generally the hardest part for students at this level is using log rules properly. For a comprehensive list see here: https://www.chilimath.com/lessons/advanced-algebra/logarithm-rules/
You will use most of these rules in solving probems in this chapter, in particular, you will often be asked to find a difference in decibels, $\Delta \beta$. In that case, you will need to write our logarithim rule ($\beta = log\left(\frac{I_1}{I_0}\right)$) twice and subtract it. By the linked log rules, when you subtract two logs, you really divide their insides in just one log! Once you do this, $I_0$ will cancel and you should end up with $\Delta \beta = log\left(\frac{I_2}{I_1}\right)$. However, you will need to show the inbetween steps on exams, so write this process up for practice until you feel confident in reproducing it yourself!
Misconceptions & Mistakes
- Intensity drops off over a surface area, so from a spherical source - which is the case for many sources we study in this class, such as speakers, light bulbs, etc. - intensity of the wave drops off with $\frac{1}{r^2}$, not with $\frac{1}{r}$.
- Mistaking Watts for Joules (and visa versa).
- Mistaking absolute intensity for sound intensity level (dB).
- Adding dB values instead of intensity values when combining sound sources.
- The Decibel scale is a log scale; if you double the intensity of a source, it does not double its value on the Decibel scale.
- The Decibel scale is a scale measured relative to the threshold of human hearing. So a Decibel reading of $0$ doesn't mean there is no intensity/no sound, it just means that the intensity of the wave is equal to the threshold of human hearing. In terms of the Decibel equation this means that $I_0 = I_1$, and the equation $\beta = log\left(\frac{I_1}{I_0}\right)$, reduces to $$\beta = log(\frac{I_0}{I_0}) = log(1) = 0$$
Pro Tips
- Intensity is a ratio of power over area, which means the same energy spread over a small area has a higher intensity than that energy spread over a large area. This is why lasers are so useful: they have incredibly high intensities because all of their power is focused on a very small area.
- The ratio $\frac{I_1}{I_2} = \frac{r_{1}^2}{r_{2}^2}$ is useful for comparing intensities of sound from the same source at different distances. This is a useful equation to have in your back pocket (a) in case you have too many unknowns and need another equation, or (b) because it sometimes helps you save a lot of work and plugging into your calculator when solving for a number on an exam.
Multiple Representations
Multiple Representations is the concept that a physical phenomena can be expressed in different ways.
Physical
The first diagram is a representation of a spherical wave form. The source at the center with spherical waves propogating outward.

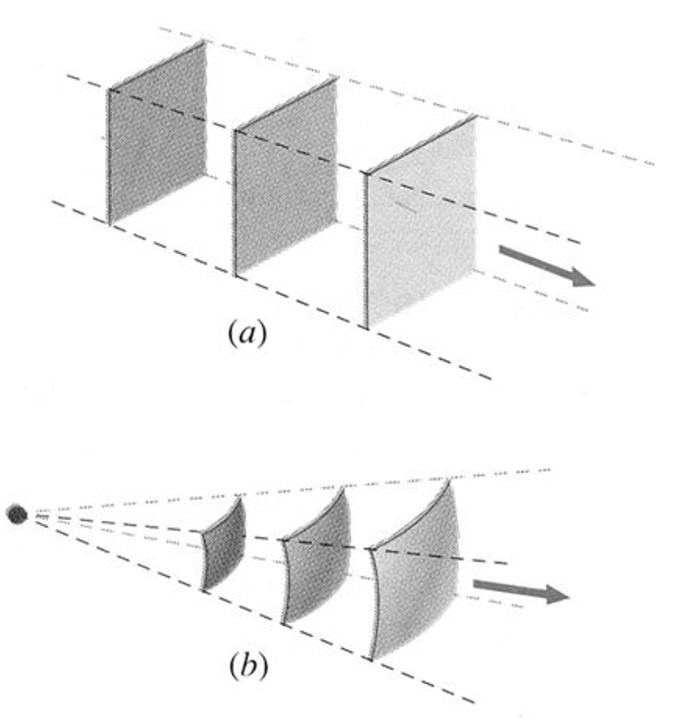
Figure (a) is a representation of plane waves and Figure (b) is a representation of spherical waves.

The diagram below desribes how the intensity is dependent upon the distance away from the source. As the wave propogates away from the source, the area increases thus decreasing the intensity.

Mathematical
$I = \frac{P}{A}$
$Power = \frac{energy}{time}$
Point source
$I = \frac{P}{4 \pi r^{2}}$
Sound intensity level
$\beta = 10_{db} log(\frac{I}{I_{0}}) , \;\; I_{0} = 10^{-12} \frac{w}{m^{2}}$
Intensity ($I$), Power ($P$), Area ($A$),


Graphical
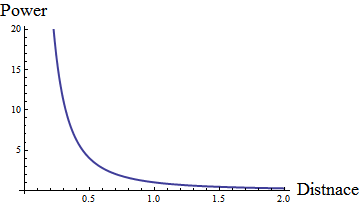
Intensity drops off as the sqaure of the distance from the source. Power vs the distance square gives us the intensity.

Descriptive
Energy and intensity of sound follows an inverse square drop off rate. Therefore, the intensity decreases quadratically as a function of distance.
Experimental
Experimental Representation examines a physical phenomena through observations and data measurement.